
- Indian Rupee struggles to gain momentum on the modestly stronger USD.
- The Fed’s hawkish stance and cautious mood weigh on the INR.
- The Indian GDP and US core PCE data will be the highlights on Friday.
Indian Rupee (INR) weakens on Friday amid the modest rebound of the US Dollar (USD). The higher-for-longer US rate mantra from the Federal Reserve (Fed) boosts the Greenback and exerts some selling pressure on assets in emerging Asian markets, including the INR. Furthermore, cautious anticipation of the key US inflation data might support the USD for the time being.
On the other hand, the decline in crude oil prices might cap the downside for the INR, as India is the third largest oil consumer. Economists see India’s economic momentum remaining strong in the January-March quarter (Q4 FY24), with GDP growth at 6.8%. The stronger-than-expected reading could underpin the Indian Rupee and weigh on the pair in the near term. On the US docket, the US Core Personal Consumption Expenditures Price Index (Core PCE) for April will be released.
Daily Digest Market Movers: Indian Rupee remains weak despite India’s robust economic outlook
- S&P Global analysts expect robust economic fundamentals in India to underpin the growth momentum over the next two to three years.
- The Indian Rupee might stand out in the emerging market foreign exchange complex, due to its high carry-to-volatility ratio, said Goldman Sachs analysts.
- The US Gross Domestic Product (GDP) expanded at an annual rate of 1.3% in the first quarter from the 1.6% growth recorded in the first estimate and came in line with the market estimation.
- Initial claims for state unemployment benefits increased by 219K for the week ending May 25, above initial estimates of 218K and above the previous weekly gain of 216K (revised from 215K).
- Chicago Fed President Austan Goolsbee said on Thursday that inflation could still fall without rising unemployment, adding that the job market remains the strongest part of the economy, per Reuters.
- Atlanta Fed President Raphael Bostic stated that inflation will come down slowly, and the Fed is unlikely to deliver an interest rate cut in July.
- New York Fed President John Williams said that there is “ample evidence” that monetary policy is restrictive and helps to bring inflation towards the 2% target. Williams added that he doesn’t feel any urgency to cut rates.
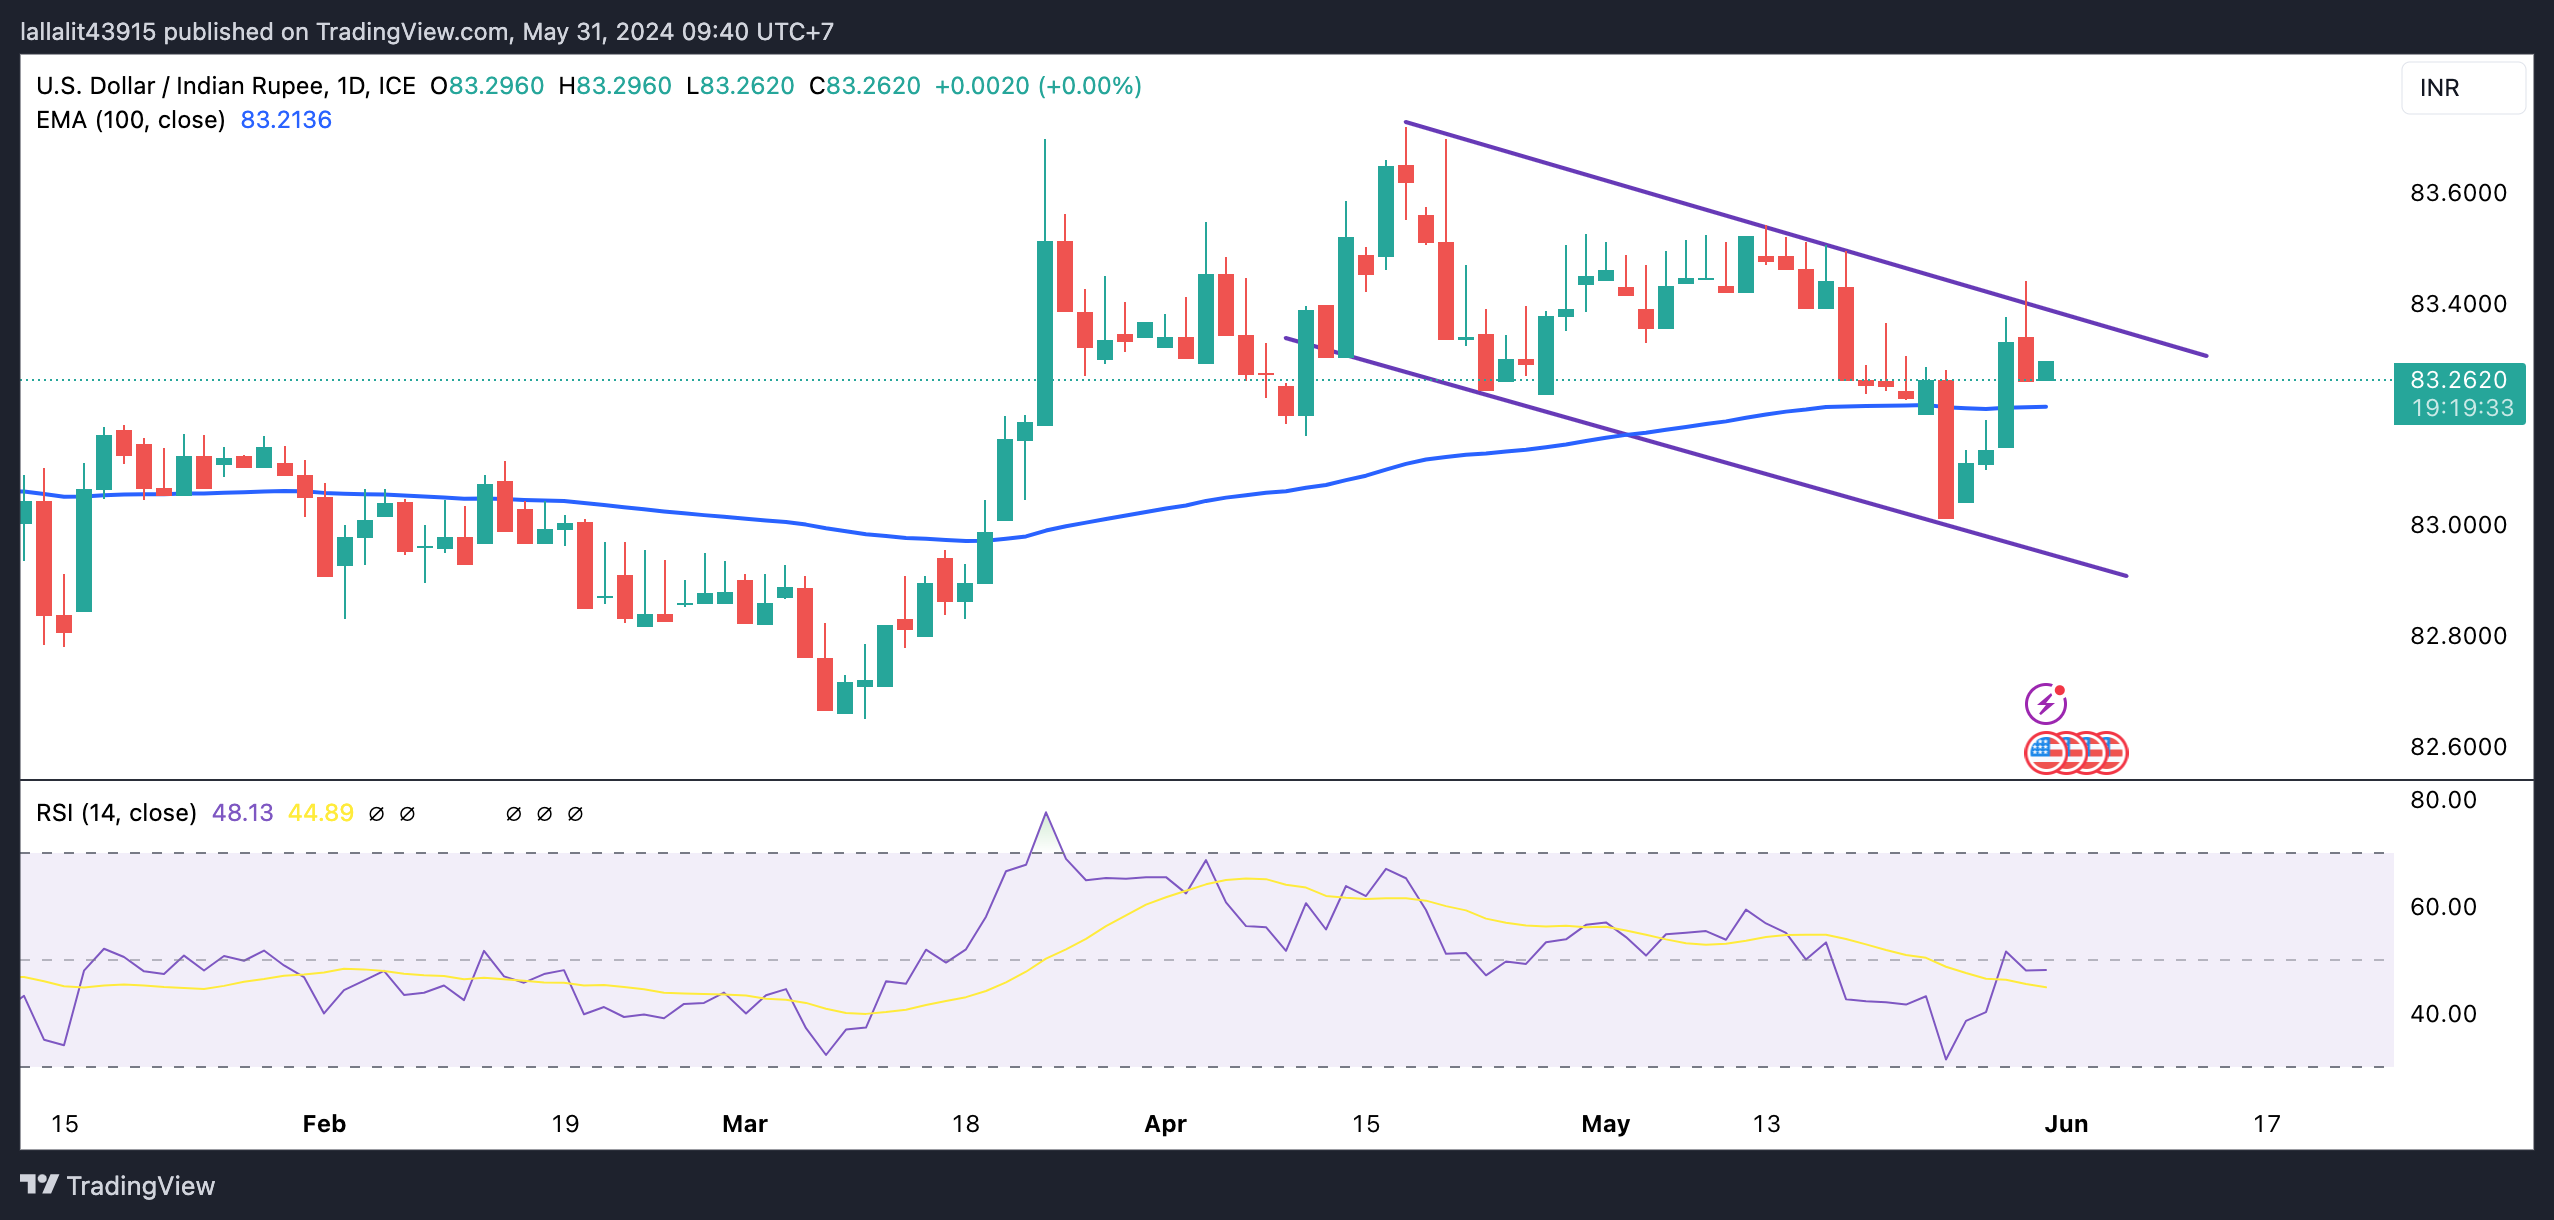
Technical analysis: USD/INR turns bullish in the longer term
The Indian Rupee trades on a weaker note on the day. The USD/INR pair resumes its bullish bias as it holds above the key 100-day Exponential Moving Average (EMA) on the daily chart. Further consolidation is not ruled out as the 14-day Relative Strength Index (RSI) hovers around the 50-midline.
USD/INR has established a descending trend channel since mid-April. The first upside barrier will emerge near the upper boundary of the channel at 83.40. A bullish breakout will pave the way to a high of May 13 at 83.54, followed by a high of April 17 at 83.72 and then the 84.00 psychological level.
On the downside, the initial support level for USD/INR is located near the 100-day EMA around 83.20. The potential downside target to watch is the 83.00 round mark. A break below the mentioned level will see a drop to a low of January 15 at 82.78 and finally a low of March 11 at 82.65.
US Dollar price in the last 7 days
The table below shows the percentage change of US Dollar (USD) against listed major currencies in the last 7 days. US Dollar was the strongest against the Euro.
| USD | EUR | GBP | CAD | AUD | JPY | NZD | CHF | |
| USD | -0.08% | -0.23% | -0.47% | -0.55% | -0.14% | -0.54% | -1.08% | |
| EUR | 0.06% | -0.16% | -0.40% | -0.47% | -0.07% | -0.43% | -1.01% | |
| GBP | 0.23% | 0.15% | -0.24% | -0.31% | 0.11% | -0.29% | -0.85% | |
| CAD | 0.45% | 0.42% | 0.25% | -0.08% | 0.33% | -0.05% | -0.62% | |
| AUD | 0.55% | 0.44% | 0.31% | 0.07% | 0.40% | 0.03% | -0.53% | |
| JPY | 0.12% | 0.06% | -0.08% | -0.33% | -0.41% | -0.35% | -0.96% | |
| NZD | 0.53% | 0.43% | 0.27% | 0.03% | -0.03% | 0.36% | -0.59% | |
| CHF | 1.06% | 1.02% | 0.85% | 0.62% | 0.53% | 0.94% | 0.55% |
The heat map shows percentage changes of major currencies against each other. The base currency is picked from the left column, while the quote currency is picked from the top row. For example, if you pick the Euro from the left column and move along the horizontal line to the Japanese Yen, the percentage change displayed in the box will represent EUR (base)/JPY (quote).
RBI FAQs
The role of the Reserve Bank of India (RBI), in its own words, is ‘..to maintain price stability while keeping in mind the objective of growth.” This involves maintaining the inflation rate at a stable 4% level primarily using the tool of interest rates. The RBI also maintains the exchange rate at a level that will not cause excess volatility and problems for exporters and importers, since India’s economy is heavily reliant on foreign trade, especially Oil.
The RBI formally meets at six bi-monthly meetings a year to discuss its monetary policy and, if necessary, adjust interest rates. When inflation is too high (above its 4% target), the RBI will normally raise interest rates to deter borrowing and spending, which can support the Rupee (INR). If inflation falls too far below target, the RBI might cut rates to encourage more lending, which can be negative for INR.
Due to the importance of trade to the economy, the Reserve Bank of India (RBI) actively intervenes in FX markets to maintain the exchange rate within a limited range. It does this to ensure Indian importers and exporters are not exposed to unnecessary currency risk during periods of FX volatility. The RBI buys and sells Rupees in the spot market at key levels, and uses derivatives to hedge its positions.
Information on these pages contains forward-looking statements that involve risks and uncertainties. Markets and instruments profiled on this page are for informational purposes only and should not in any way come across as a recommendation to buy or sell in these assets. You should do your own thorough research before making any investment decisions. FXStreet does not in any way guarantee that this information is free from mistakes, errors, or material misstatements. It also does not guarantee that this information is of a timely nature. Investing in Open Markets involves a great deal of risk, including the loss of all or a portion of your investment, as well as emotional distress. All risks, losses and costs associated with investing, including total loss of principal, are your responsibility. The views and opinions expressed in this article are those of the authors and do not necessarily reflect the official policy or position of FXStreet nor its advertisers. The author will not be held responsible for information that is found at the end of links posted on this page.
If not otherwise explicitly mentioned in the body of the article, at the time of writing, the author has no position in any stock mentioned in this article and no business relationship with any company mentioned. The author has not received compensation for writing this article, other than from FXStreet.
FXStreet and the author do not provide personalized recommendations. The author makes no representations as to the accuracy, completeness, or suitability of this information. FXStreet and the author will not be liable for any errors, omissions or any losses, injuries or damages arising from this information and its display or use. Errors and omissions excepted.
The author and FXStreet are not registered investment advisors and nothing in this article is intended to be investment advice.


