
- Gold gains as softer-than-expected US Retail Sales boost rate cut expectations.
- Fed officials’ comments reveal mixed views on the timing of potential rate cuts.
- 10-year Treasury yield drops six basis points to 4.219%, reflecting market speculation on future rate cuts.
Gold prices rose on Tuesday after economic data from the United States (US) hinted that consumer spending is constraining due to a softer-than-estimated Retail Sales report. This fueled speculation that the Federal Reserve (Fed) could begin its easing cycle this year. The XAU/USD trades at $2,327, up 0.51%.
The US Department of Commerce revealed that May’s Retail Sales improved compared to April’s data, which was downwardly revised but missed the mark. That data reignited investors’ rate cut hopes as the Fed signaled in the last meeting that current monetary policy is appropriate.
Other data showed that Industrial Production improved in May, followed by a downward revision in April.
Aside from economic data, Fed officials have crossed the newswires. New York Fed President John Williams said that interest rates would decrease gradually if the disinflation process continued to evolve toward the Fed’s 2% annual core inflation goal. Despite dodging a question about a rate cut in September, he added, “I think that things are moving in the right direction.”
Richmond Fed President Thomas Barkin was cautious, saying he needs to see more data before easing. Later, Boston Fed President Susan Collins said she isn’t carried away about just one good reading on inflation and added that it’s not time to cut rates.
The newly named St. Louis Fed President, Alberto Musalem, stated that he needs to see an evolution in the disinflation process before voting to cut rates. He added that if inflation halts, he favors a rate hike, though it’s not his base case scenario.
Even though most policymakers struck a neutral stance, US Treasury yields reflect investors beginning to price in rate cuts. The 10-year Treasury note yield is down six basis points at 4.219%.
Data from the Chicago Board of Trade (CBOT) shows traders expect 36 bps of easing during the year via December’s 2024 fed funds rate contract.
Daily digest market movers: Gold price jumps as US yields drop
- US Dollar Index (DXY) decreased by 0.05% to 105.27, putting a lid on Gold prices.
- US Retail Sales for May increased by 0.1% MoM, improving from April’s 0.2% decline but falling short of the 0.2% estimate. On an annual basis, sales decreased from 2.7% to 2.3%.
- US Industrial Production in May surpassed expectations of a 0.3% increase, rising by 0.9% MoM.
- Last week’s CPI report raised the odds of a Fed rate cut in September from 57% to 62%, according to the CME FedWatch Tool.
- Despite the US CPI report showing that the disinflation process continues, Fed Chair Jerome Powell commented that they remain “less confident” about the progress on inflation.
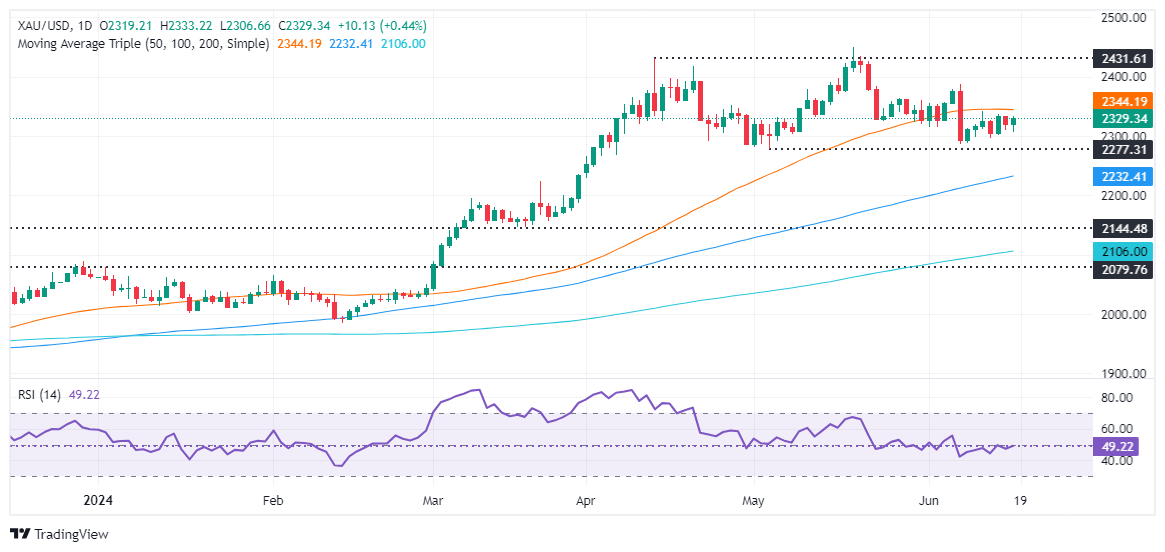
Technical analysis: Gold price remains bearishly biased despite rising
Gold price is neutral to downwardly biased as the bearish Head-and-Shoulders chart pattern remains in play. Although the yellow metal achieved a leg up in the near term, momentum favors sellers, which can be seen by the Relative Strength Index (RSI).
If XAU/USD drops below $2,300, the next support would be the May 3 low of $2,277, followed by the March 21 high of $2,222. Further losses lie beneath as sellers would eye the Head-and-Shoulders chart pattern objective from $2,170 to $2,160.
Conversely, if Gold extends its gains past $2,350, key resistance levels emerge like the June 7 cycle high of $2,387, ahead of challenging the $2,400 figure.
Economic Indicator
Retail Sales (MoM)
The Retail Sales data, released by the US Census Bureau on a monthly basis, measures the value in total receipts of retail and food stores in the United States. Monthly percent changes reflect the rate of changes in such sales. A stratified random sampling method is used to select approximately 4,800 retail and food services firms whose sales are then weighted and benchmarked to represent the complete universe of over three million retail and food services firms across the country. The data is adjusted for seasonal variations as well as holiday and trading-day differences, but not for price changes. Retail Sales data is widely followed as an indicator of consumer spending, which is a major driver of the US economy. Generally, a high reading is seen as bullish for the US Dollar (USD), while a low reading is seen as bearish.
Last release: Tue Jun 18, 2024 12:30
Frequency: Monthly
Actual: 0.1%
Consensus: 0.2%
Previous: 0%
Source: US Census Bureau
Retail Sales data published by the US Census Bureau is a leading indicator that gives important information about consumer spending, which has a significant impact on the GDP. Although strong sales figures are likely to boost the USD, external factors, such as weather conditions, could distort the data and paint a misleading picture. In addition to the headline data, changes in the Retail Sales Control Group could trigger a market reaction as it is used to prepare the estimates of Personal Consumption Expenditures for most goods.
Information on these pages contains forward-looking statements that involve risks and uncertainties. Markets and instruments profiled on this page are for informational purposes only and should not in any way come across as a recommendation to buy or sell in these assets. You should do your own thorough research before making any investment decisions. FXStreet does not in any way guarantee that this information is free from mistakes, errors, or material misstatements. It also does not guarantee that this information is of a timely nature. Investing in Open Markets involves a great deal of risk, including the loss of all or a portion of your investment, as well as emotional distress. All risks, losses and costs associated with investing, including total loss of principal, are your responsibility. The views and opinions expressed in this article are those of the authors and do not necessarily reflect the official policy or position of FXStreet nor its advertisers. The author will not be held responsible for information that is found at the end of links posted on this page.
If not otherwise explicitly mentioned in the body of the article, at the time of writing, the author has no position in any stock mentioned in this article and no business relationship with any company mentioned. The author has not received compensation for writing this article, other than from FXStreet.
FXStreet and the author do not provide personalized recommendations. The author makes no representations as to the accuracy, completeness, or suitability of this information. FXStreet and the author will not be liable for any errors, omissions or any losses, injuries or damages arising from this information and its display or use. Errors and omissions excepted.
The author and FXStreet are not registered investment advisors and nothing in this article is intended to be investment advice.


