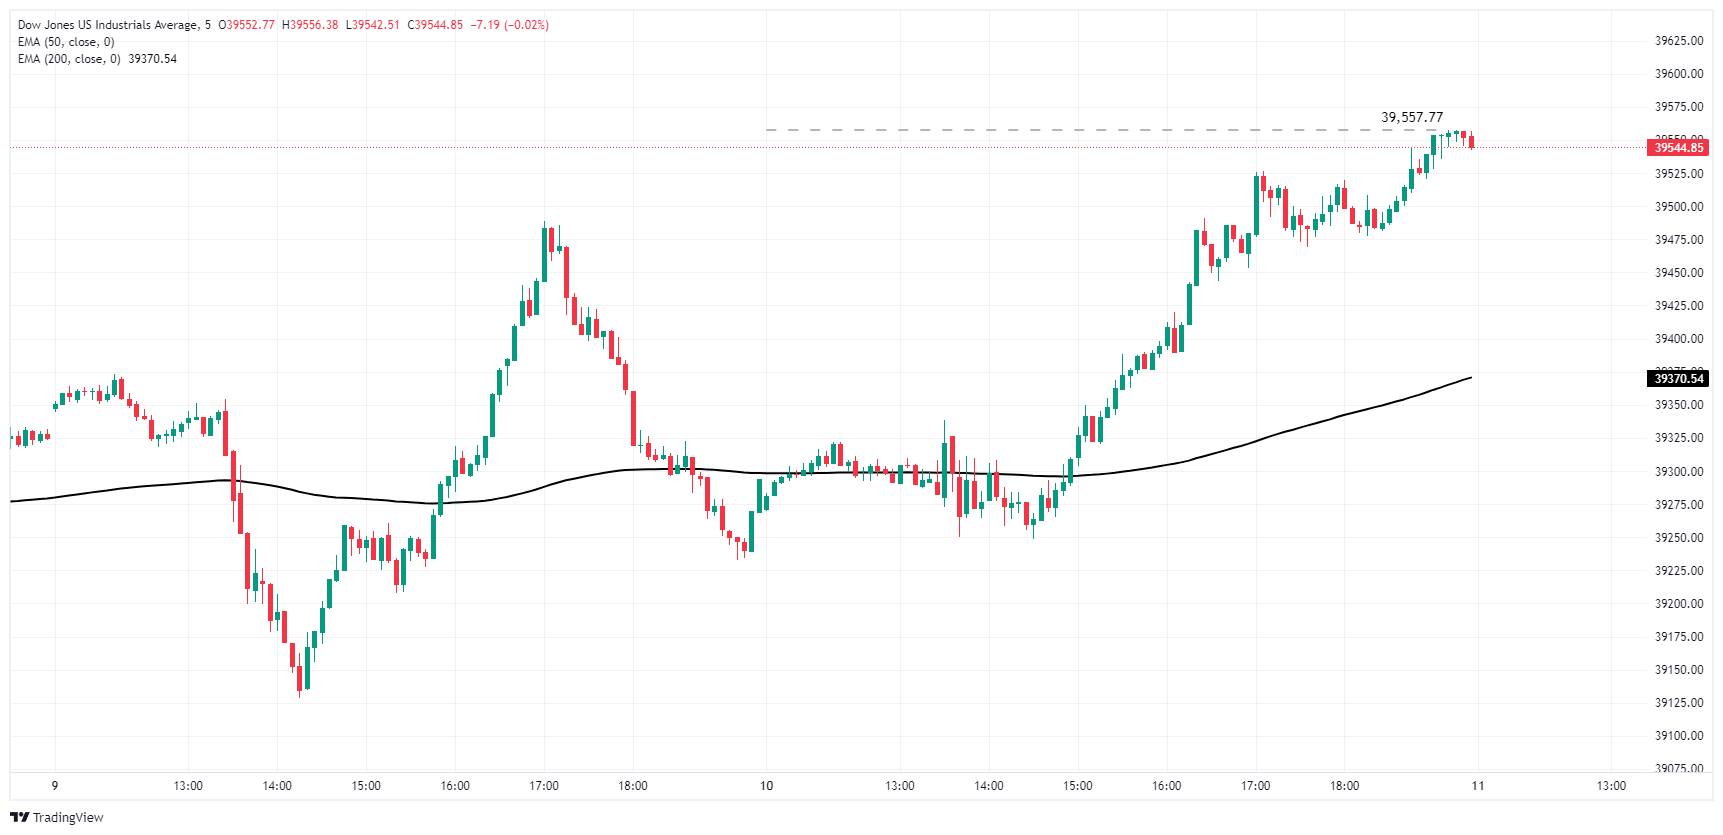
- Dow Jones climbed above 39,550.00 as markets read between the lines.
- Fed Chair Powell wraps up two-day Congressional testimony.
- Markets look ahead to key US inflation data later in the week.
The Dow Jones Industrial Average (DJIA) climbed on Wednesday, gaining over 400 points and testing above 39,550.00 as equity markets stepped back into a risk-on stance. Rate cut hopes continue to underpin broader market flows, and investors have recovered their footing and brushed off an overall cautious tone from Federal Reserve (Fed) Chairman Jerome Powell.
Fed Chair Powell wrapped up the second of a two-day appearance before US Congressional committees on Wednesday, with the head of the US central bank sticking close to a familiar script across both days. While giving a nod of the head to overall progress on inflation, and admitting that the Fed isn’t going to wait until inflation hits the 2% annual target, Fed Chair Powell remains firmly planted in a cautious stance. While the Fed won’t be waiting for inflation to hit the overall target, Fed officials still want further evidence that inflation will eventually hit 2% before delivering rate cuts.
According to the CME’s FedWatch Tool, rate markets still have hopes firmly pinned on a September rate cut, with interest rate traders pricing in 75% odds of at least a quarter-point trim to the fed funds rate on September 18.
With the Fed entrenched in a wait for further signs of easing inflation, markets will be firmly focused on US inflation figures due this week. US Consumer Price Index (CPI) inflation is slated for Thursday, with US Producer Price Index (PPI) wholesale inflation due on Friday. Rate-cut-hungry investors may be set up for disappointment with June’s annualized core CPI expected to hold steady at 3.4%, and Friday’s YoY core PPI expected to actually tick higher to 2.5% from the previous 2.3%.
Dow Jones news
The Dow Jones firmly shook off cautious tones on Wednesday, rallying to a daily high of 39,554.55 and climbing over 400 points. All but two of the Dow Jones’ listed securities were in the green on Wednesday, with Home Depot Inc. (HD) making a late break to climb 2.1% to $344.18 per share, closely followed by Traveler’s Companies Inc. (TRV) and 3M Co. (MMM) which rose 2.0% apiece.
Dow Jones technical outlook
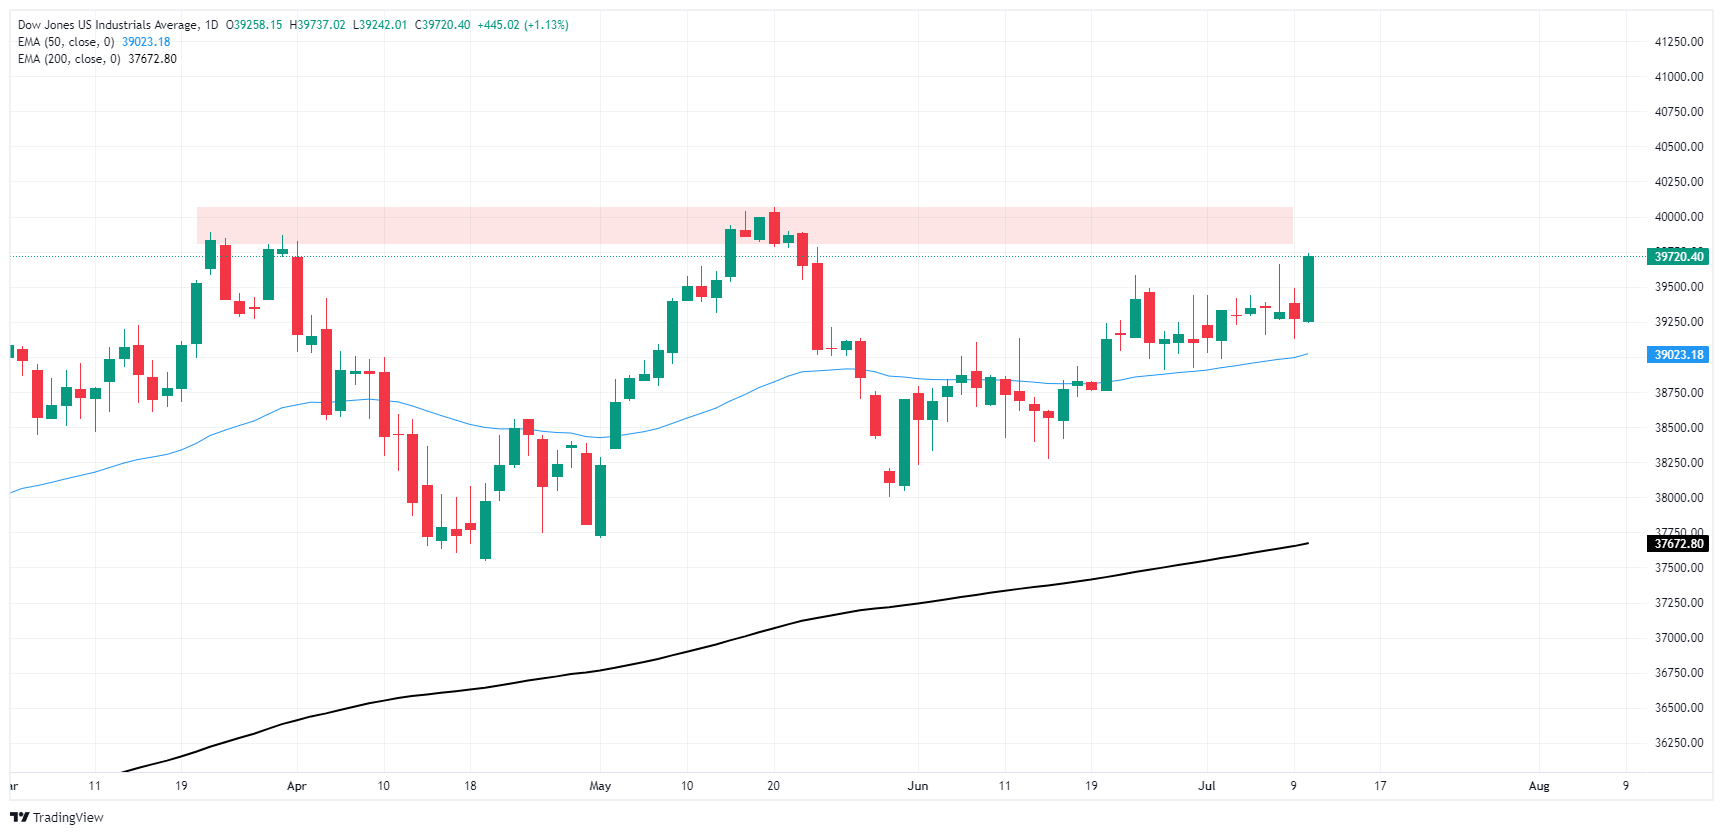
The Dow Jones has given a choppy two-day performance, climbing a full percentage point bottom-to-top from Tuesday’s lows near 39,130.00. Bullish momentum is poised for a breakout of recent consolidation as price action gets squeezed between the 50-day Exponential Moving Average (EMA) near 39,000.00 and a supply zone priced in near the 40,000.00 major price handle.
Dow Jones five minute chart
Dow Jones daily chart
Economic Indicator
Consumer Price Index ex Food & Energy (MoM)
Inflationary or deflationary tendencies are measured by periodically summing the prices of a basket of representative goods and services and presenting the data as the Consumer Price Index (CPI). CPI data is compiled on a monthly basis and released by the US Department of Labor Statistics. The MoM print compares the prices of goods in the reference month to the previous month.The CPI Ex Food & Energy excludes the so-called more volatile food and energy components to give a more accurate measurement of price pressures. Generally speaking, a high reading is seen as bullish for the US Dollar (USD), while a low reading is seen as bearish.
The US Federal Reserve has a dual mandate of maintaining price stability and maximum employment. According to such mandate, inflation should be at around 2% YoY and has become the weakest pillar of the central bank’s directive ever since the world suffered a pandemic, which extends to these days. Price pressures keep rising amid supply-chain issues and bottlenecks, with the Consumer Price Index (CPI) hanging at multi-decade highs. The Fed has already taken measures to tame inflation and is expected to maintain an aggressive stance in the foreseeable future.
Information on these pages contains forward-looking statements that involve risks and uncertainties. Markets and instruments profiled on this page are for informational purposes only and should not in any way come across as a recommendation to buy or sell in these assets. You should do your own thorough research before making any investment decisions. FXStreet does not in any way guarantee that this information is free from mistakes, errors, or material misstatements. It also does not guarantee that this information is of a timely nature. Investing in Open Markets involves a great deal of risk, including the loss of all or a portion of your investment, as well as emotional distress. All risks, losses and costs associated with investing, including total loss of principal, are your responsibility. The views and opinions expressed in this article are those of the authors and do not necessarily reflect the official policy or position of FXStreet nor its advertisers. The author will not be held responsible for information that is found at the end of links posted on this page.
If not otherwise explicitly mentioned in the body of the article, at the time of writing, the author has no position in any stock mentioned in this article and no business relationship with any company mentioned. The author has not received compensation for writing this article, other than from FXStreet.
FXStreet and the author do not provide personalized recommendations. The author makes no representations as to the accuracy, completeness, or suitability of this information. FXStreet and the author will not be liable for any errors, omissions or any losses, injuries or damages arising from this information and its display or use. Errors and omissions excepted.
The author and FXStreet are not registered investment advisors and nothing in this article is intended to be investment advice.


