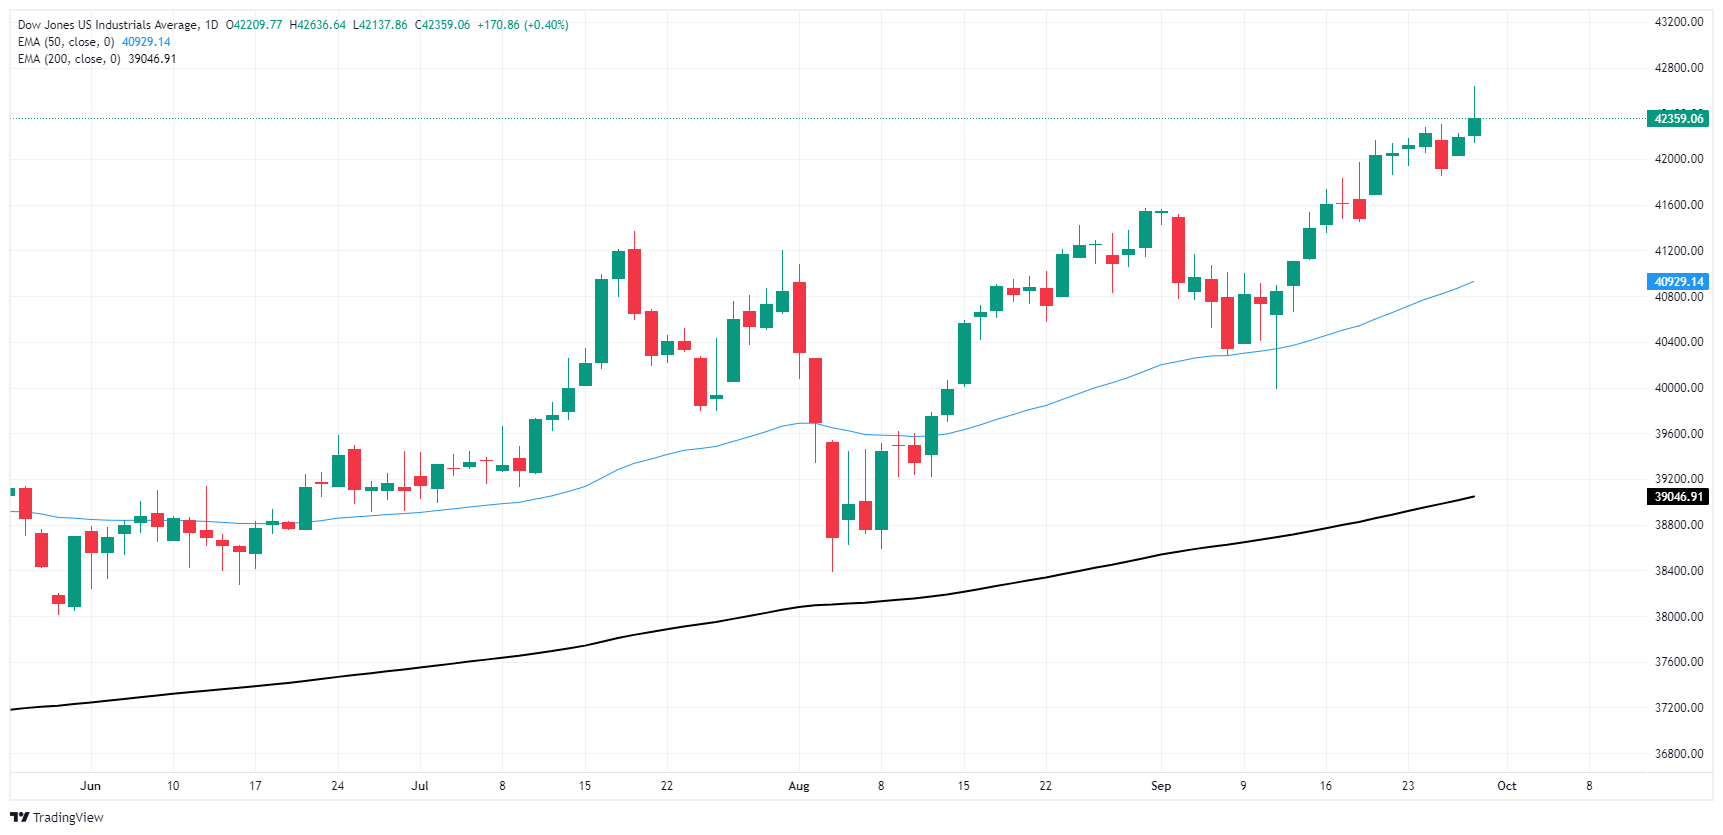
- The Dow Jones climbed into another fresh peak after PCE inflation print.
- Headline PCE inflation eased closer to Fed targets in August.
- Coming up next week: PMI activity measures, NFP labor print.
The Dow Jones Industrial Average (DJIA) rallied into another fresh record high on Friday, spurred higher by a cooler-than-expected print in the US Personal Consumption Expenditure Price Index (PCE) for August. Sentiment indicators also improved for September, and rate watchers will be pivoting to look ahead to next week’s Nonfarm Payrolls (NFP) report.
The PCE price index rose 0.1% in August, and chalked in PCE inflation growth of just 2.2% YoY, easing to the key inflation indicator’s lowest level since March of 2021. Headline inflation figures continue to ease toward the Federal Reserve’s (Fed) 2% target, but data watchers will note that the annualized core PCE print ticked higher for the year ended August, rising to 2.7% YoY from the previous 2.6%.
The University of Michigan’s (UoM) Consumer Sentiment Index rose again in September, printing at 70.1 compared to the expected 69.3 and even higher than the previous month’s print of 69.0. The UoM’s 5-year Consumer Inflation Expectations survey also held steady at 3.1% as elevated inflation expectations at the consumer level remain pervasive.
With this week’s data docket in the books, Fed watchers will be looking ahead to the next key data print, next Friday’s NFP labor report. Markets will broadly be looking for ongoing strength is the US labor market to further quell concerns about a potential recession looming over the US economy. US Purchasing Managers Index (PMI) business activity results are also expected early next week.
Dow Jones news
The Dow Jones leaned heavily into the bullish side on Friday, clipping a fresh record bid with most of the index’s individual stocks tilting into the green side. Only five of the Dow Jones’ constituent securities were stuck in the red for the day, with Amazon (AMZN) falling 1.5% to $188 per share. On the high end, Chevron (CVX) led the charge higher, rising 2.35% and climbing over the $145 per share level.
Dow Jones price forecast
The Dow Jones found a new record bid to wrap up the trading week, chalking in a new all-time high of 42,6365 before easing back below 42,500. Despite a regular stream of broken record highs, Dow Jones bulls are struggling to snag confident climbs, and bears are waiting just outside of the doors for an opportunity to drag price action back to the 50-day Exponential Moving Average (EMA) at 40,930.
Dow Jones daily chart
Economic Indicator
Personal Consumption Expenditures – Price Index (YoY)
The Personal Consumption Expenditures (PCE), released by the US Bureau of Economic Analysis on a monthly basis, measures the changes in the prices of goods and services purchased by consumers in the United States (US). The YoY reading compares prices in the reference month to a year earlier. Price changes may cause consumers to switch from buying one good to another and the PCE Deflator can account for such substitutions. This makes it the preferred measure of inflation for the Federal Reserve. Generally, a high reading is bullish for the US Dollar (USD), while a low reading is bearish.
Information on these pages contains forward-looking statements that involve risks and uncertainties. Markets and instruments profiled on this page are for informational purposes only and should not in any way come across as a recommendation to buy or sell in these assets. You should do your own thorough research before making any investment decisions. FXStreet does not in any way guarantee that this information is free from mistakes, errors, or material misstatements. It also does not guarantee that this information is of a timely nature. Investing in Open Markets involves a great deal of risk, including the loss of all or a portion of your investment, as well as emotional distress. All risks, losses and costs associated with investing, including total loss of principal, are your responsibility. The views and opinions expressed in this article are those of the authors and do not necessarily reflect the official policy or position of FXStreet nor its advertisers. The author will not be held responsible for information that is found at the end of links posted on this page.
If not otherwise explicitly mentioned in the body of the article, at the time of writing, the author has no position in any stock mentioned in this article and no business relationship with any company mentioned. The author has not received compensation for writing this article, other than from FXStreet.
FXStreet and the author do not provide personalized recommendations. The author makes no representations as to the accuracy, completeness, or suitability of this information. FXStreet and the author will not be liable for any errors, omissions or any losses, injuries or damages arising from this information and its display or use. Errors and omissions excepted.
The author and FXStreet are not registered investment advisors and nothing in this article is intended to be investment advice.


