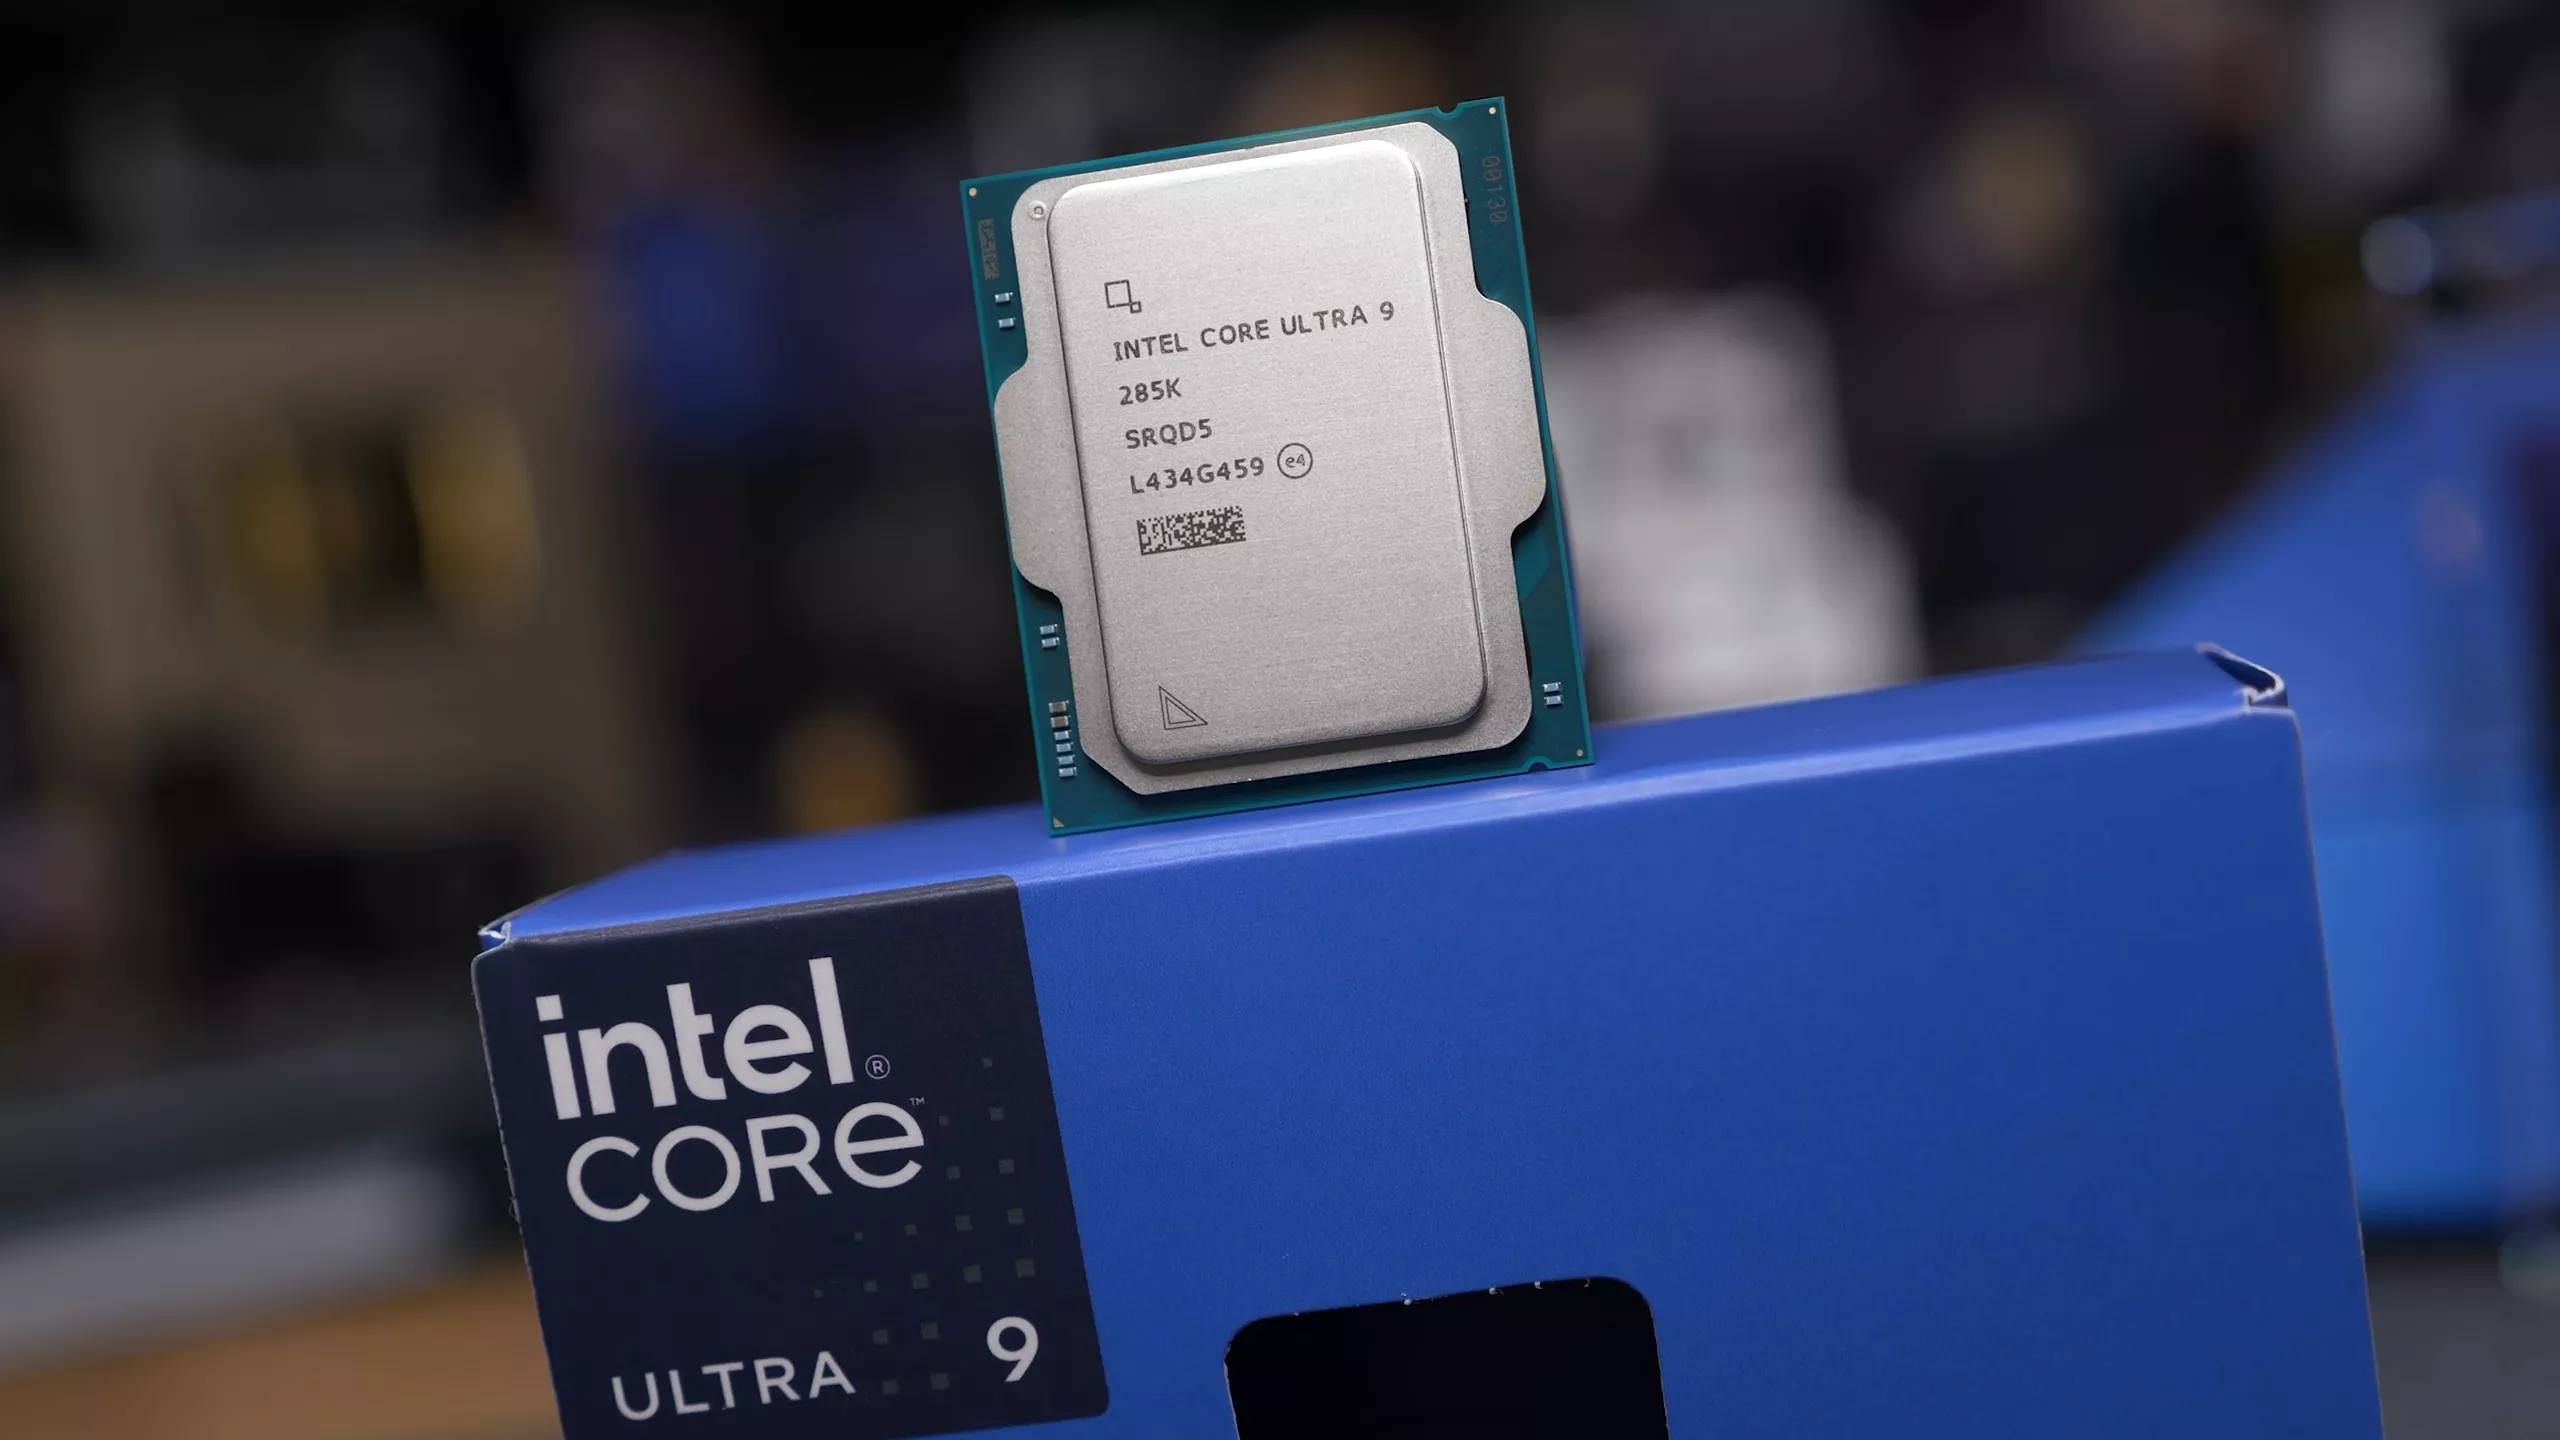
Today, we can finally take the covers off Intel’s latest CPU generation, the “Core Ultra” series, codenamed Arrow Lake. The Arrow Lake architecture is new for desktop systems, using a tile-based processor design, with the goal of moving away from a large monolithic chip based on the latest node and instead splitting the CPU into blocks, or “tiles,” as they’re commonly referred to.
This approach allows Intel to develop the CPU cores and iGPU using cutting-edge nodes, while other aspects of the processor, such as I/O interfaces, can be built using an older, more cost-effective node. This approach is similar to what AMD has been doing with Ryzen.
Since Arrow Lake represents such a radical change from the previous Raptor Lake generation, we could spend a lot of time discussing the architectural and platform changes, some of which we’ve been covering over time in anticipation for this release. However, since most of you are here for the benchmarks and actual performance results, we’ll quickly go over the flagship CPU we’re testing today, touch on the new platform, and then dive into the graphs.
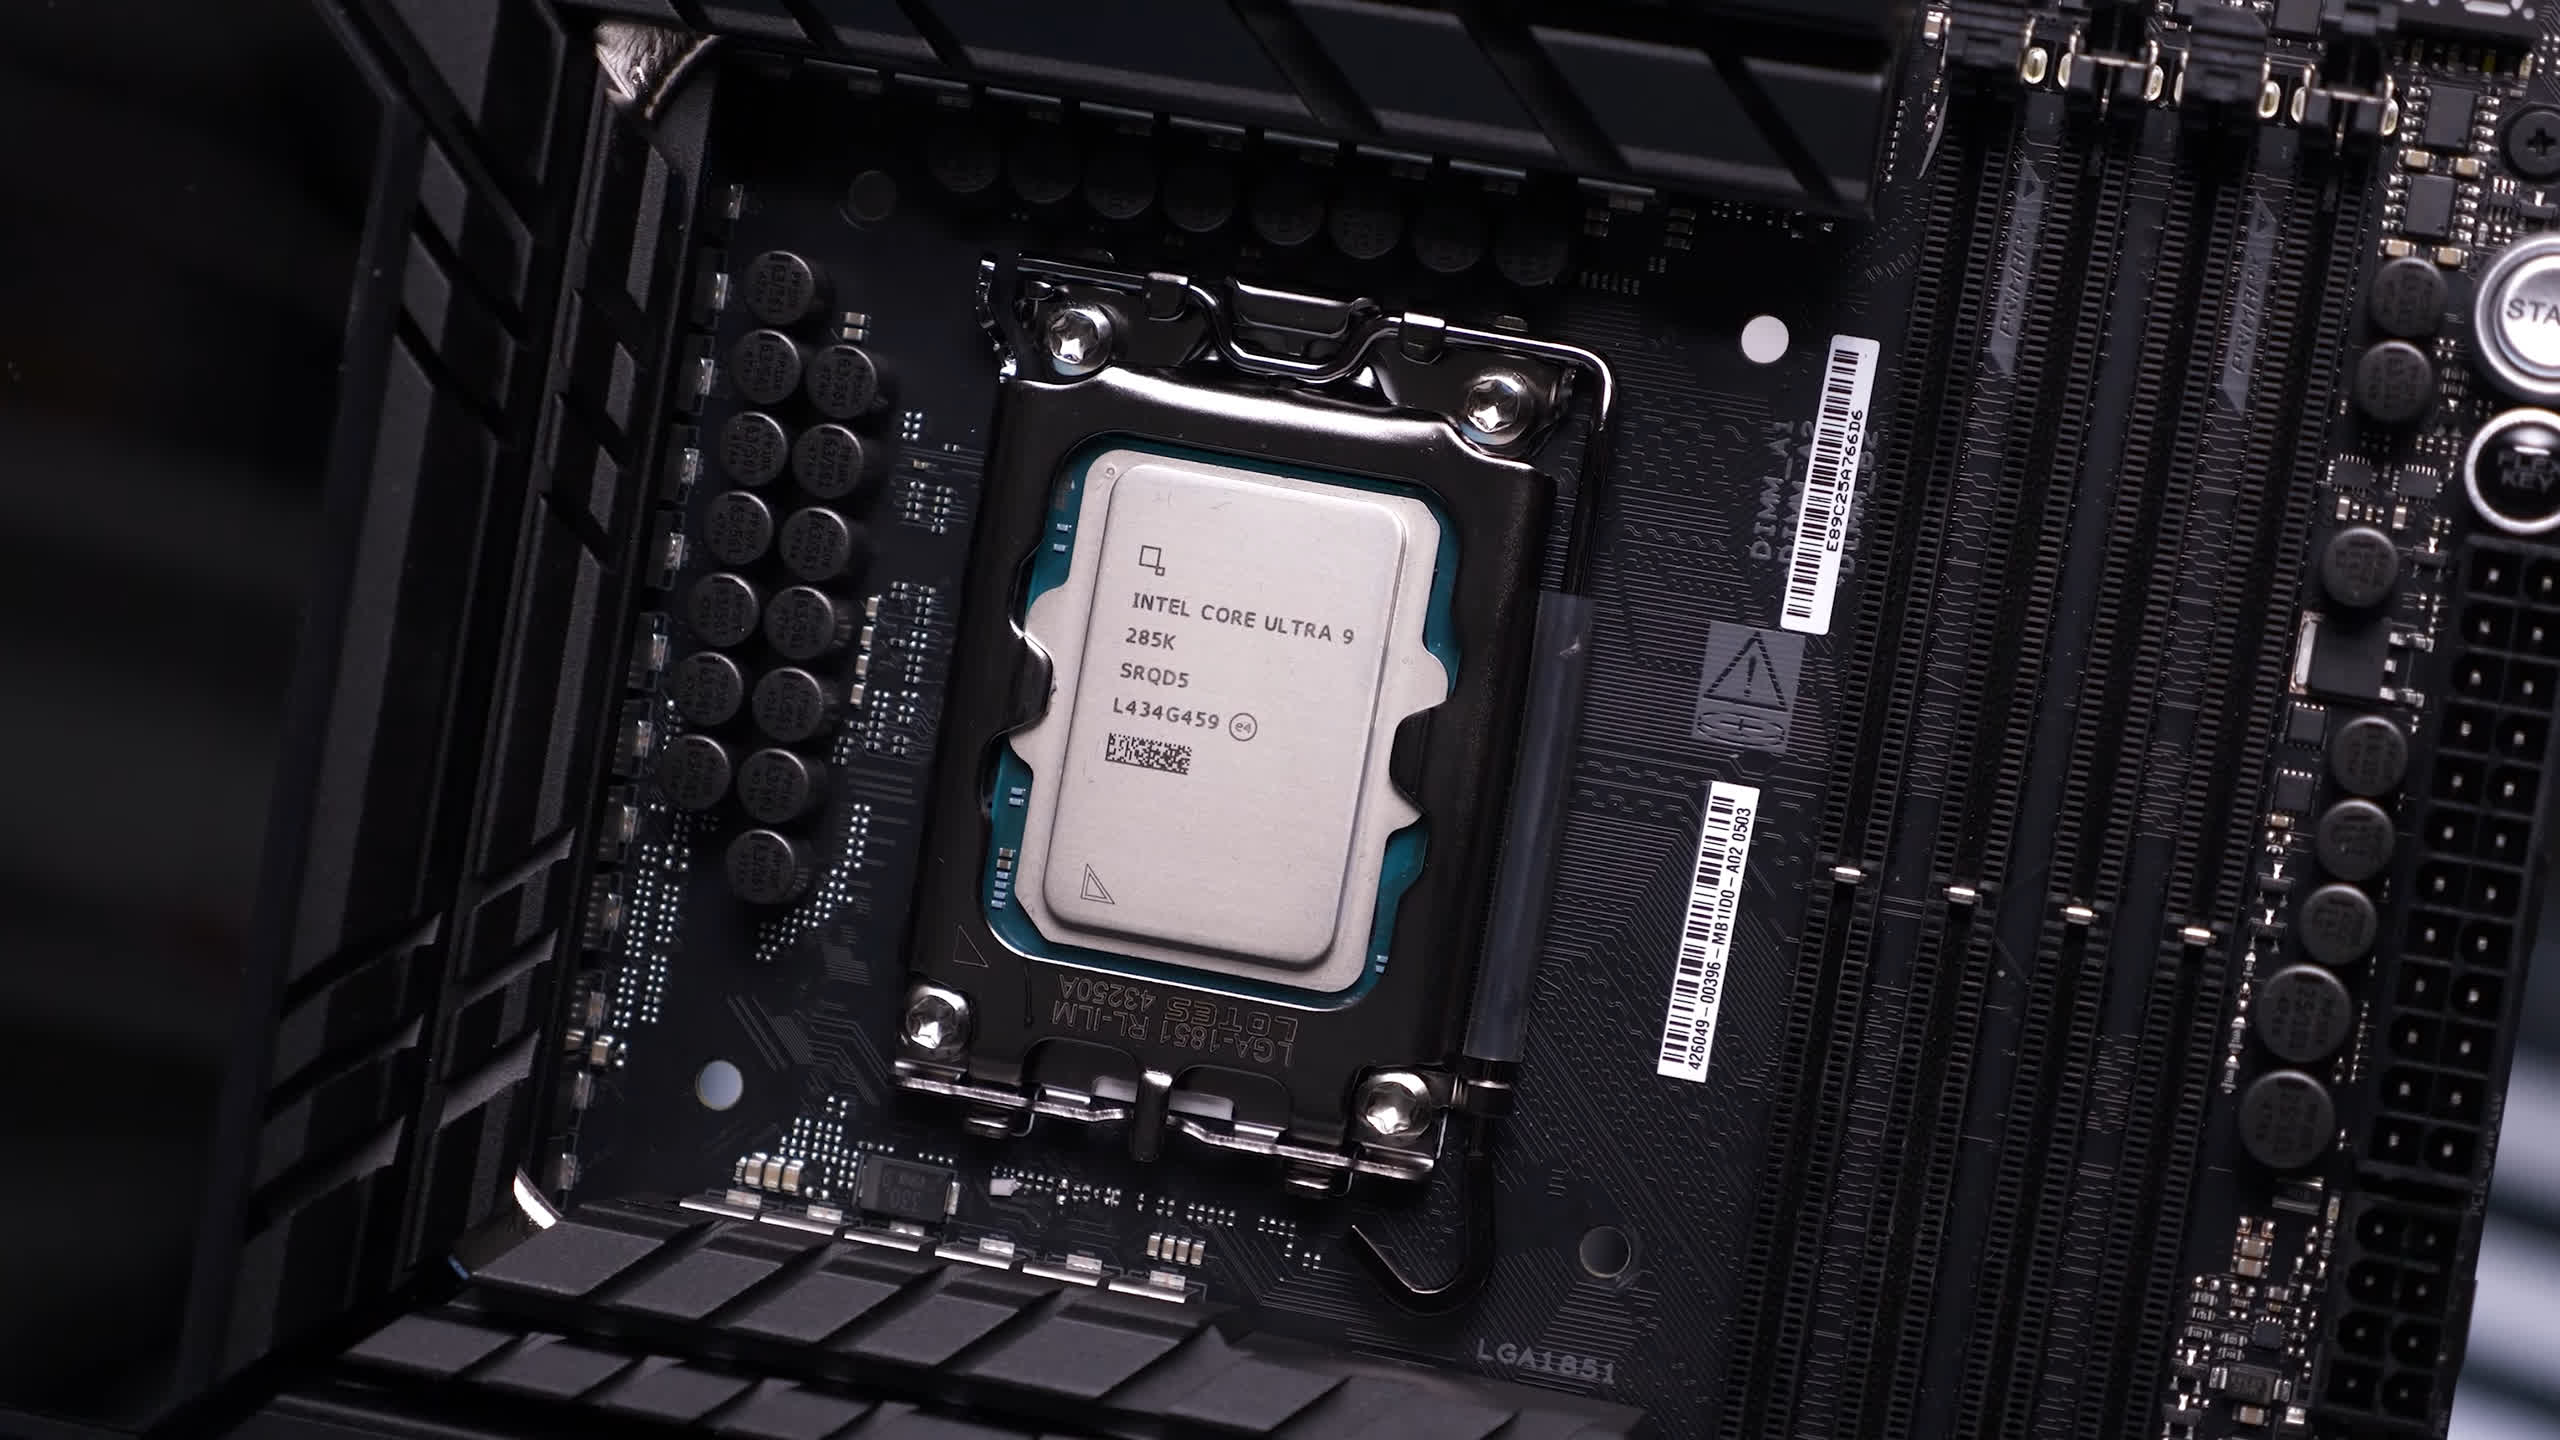
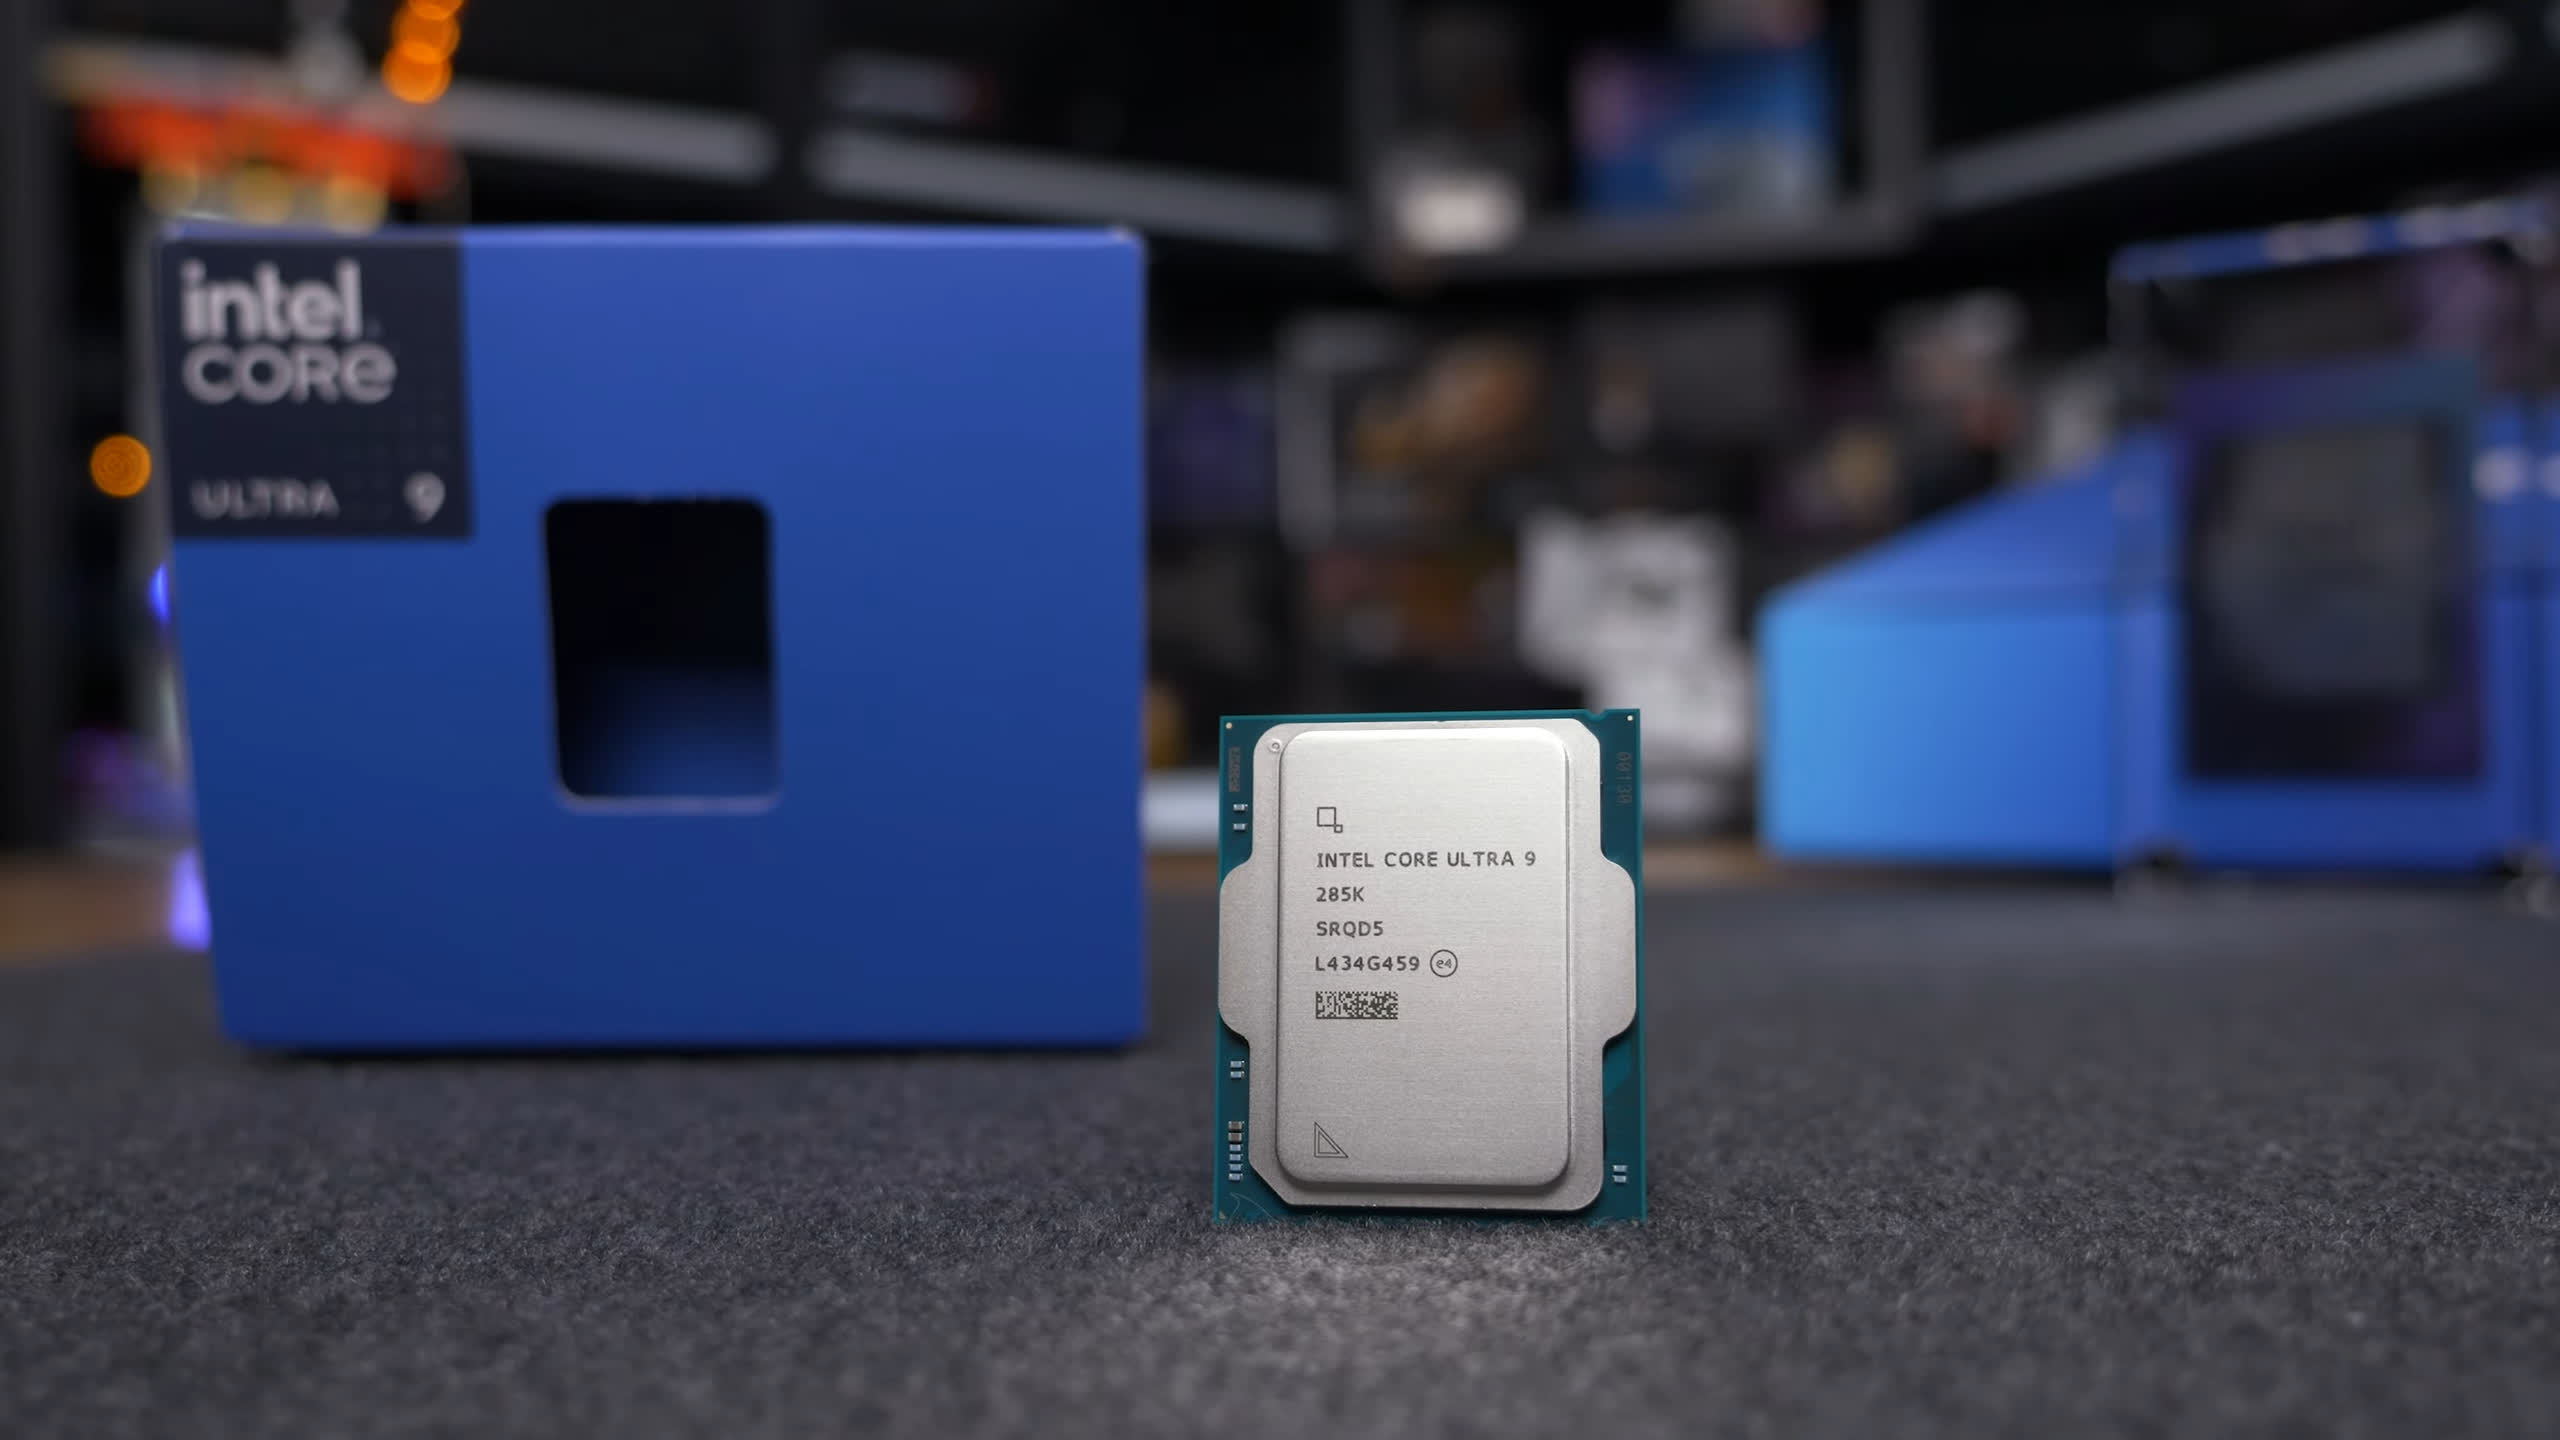
Meet the new Core Ultra 9 285K
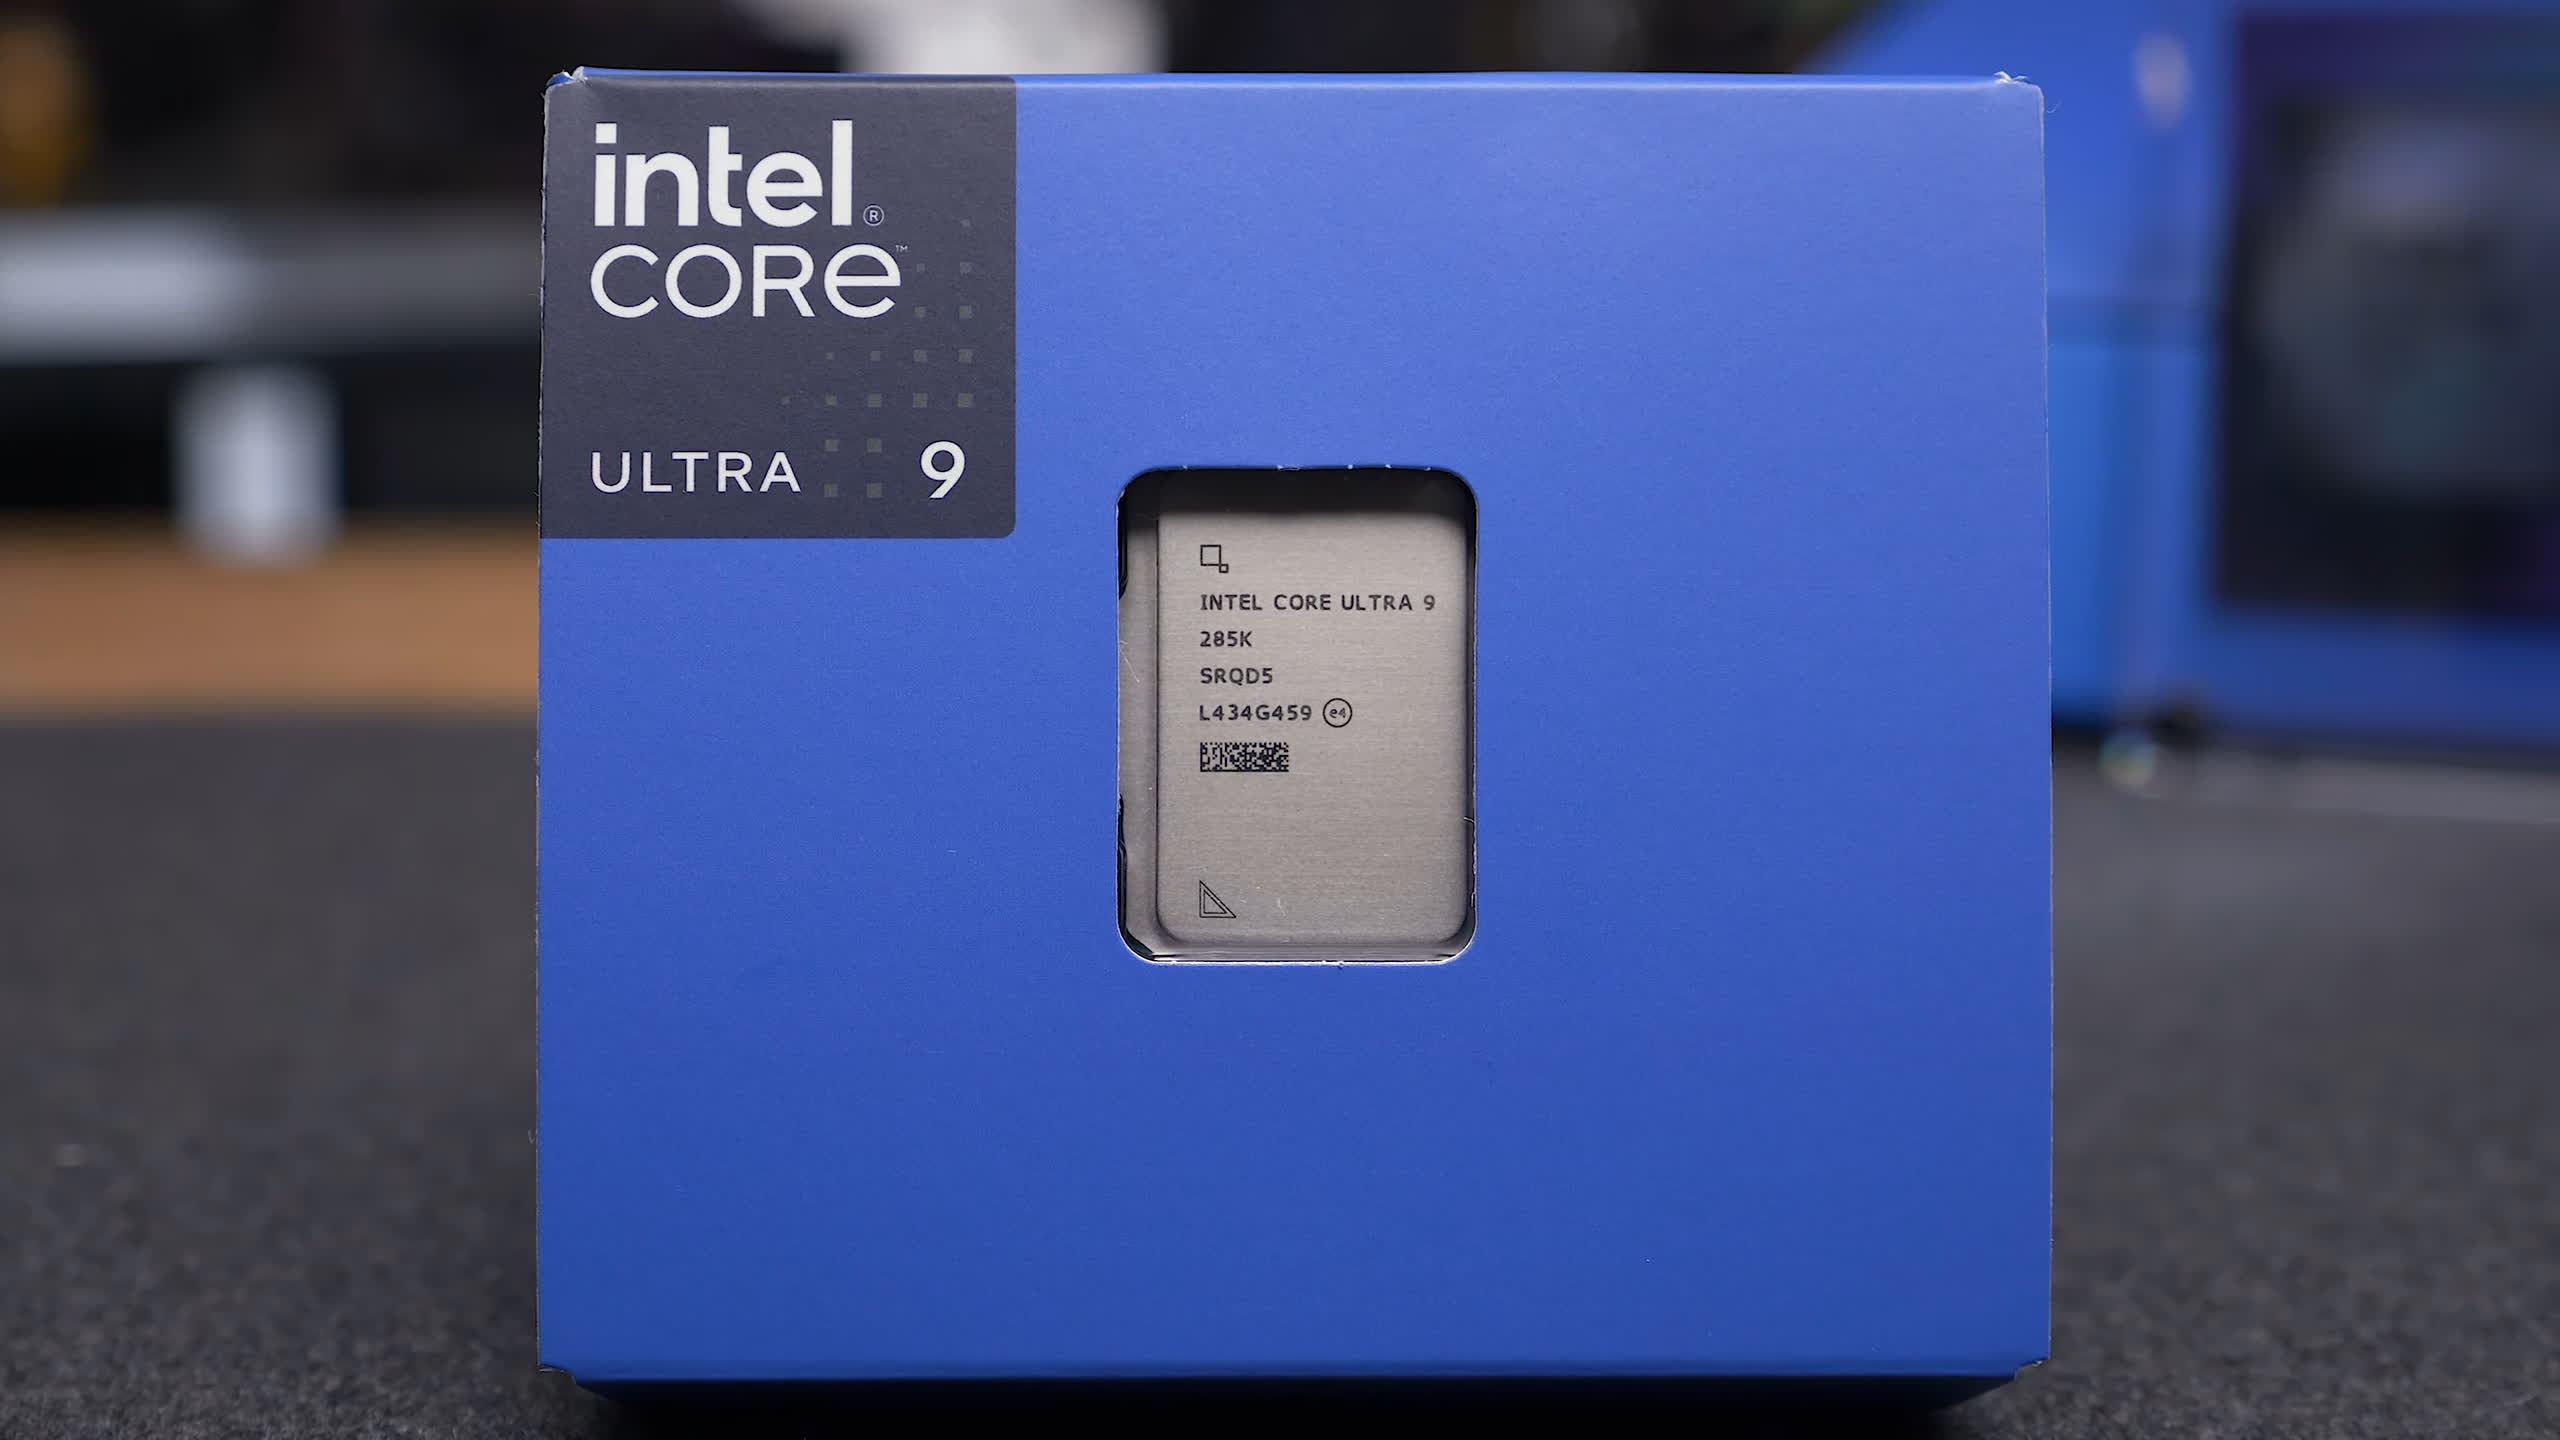
The new flagship is the Core Ultra 9 285K. Yes, it’s not the best name, and yes, the ‘Ultra’ is unnecessary, but Intel is just following the trend – modern product names tend to be unnecessarily long and somewhat uninspired, so that box is checked.
The 285K features 8 P-Cores with 8 threads, as Hyper-Threading is no longer used. These P-Cores have a base frequency of 3.7 GHz, boosting up to 5.6 GHz, with a thermal velocity boost of 5.7 GHz – resulting in a 5% frequency reduction compared to the 14900K.
There are also 16 E-Cores, each with 1 thread, as there is no SMT support here. These E-Cores operate at a base frequency of 3.2 GHz, with a boost up to 4.6 GHz, which is a 5% increase over the E-Cores in the 14900K.
| Processor | Release price | P-core (performance) | E-core (efficiency) | L3 cache | ||||||
|---|---|---|---|---|---|---|---|---|---|---|
| Cores (threads) | Freq. | Turbo | L2 cache | Cores (threads) | Freq. | Turbo | L2 cache | |||
| Core Ultra 9 285K | $600 | 8 (8) | 3.7 GHz | 5.6 GHz | 24 MB | 16 (16) | 3.2 GHz | 4.6 GHz | 16 MB | 36 MB |
| Core Ultra 7 265K | $395 | 8 (8) | 3.9 GHz | 5.5 GHz | 12 (12) | 3.3 GHz | 12 MB | 30 MB | ||
| Core Ultra 5 245K | $310 | 6 (6) | 4.2 GHz | 5.2 GHz | 18 MB | 8 (8) | 3.6 GHz | 8 MB | 24 MB | |
| Core i9-14900K | $600 | 8 (16) | 3.2 GHz | 6.0 GHz | 16 MB | 16 (16) | 2.4 GHz | 4.4 GHz | 16 MB | 36 MB |
| Core i7-14700K | $420 | 8 (16) | 3.4 GHz | 5.6 GHz | 12 (12) | 2.5 GHz | 4.3 GHz | 12 MB | 33 MB | |
| Core i5-14600K | $330 | 6 (12) | 3.5 GHz | 5.3 GHz | 12 MB | 8 (8) | 2.6 GHz | 4.0 GHz | 8 MB | 24 MB |
In total, there are 36 MB of L3 cache and 40 MB of L2 cache. Each P-Core gets 3 MB of L2 cache, while the E-Cores are grouped into clusters of four, with each cluster sharing 4 MB of L2 cache. Finally, the base TDP is 125W, with a max turbo TDP of 250W. Intel is pricing this at $590 per 1,000 units, so we expect an initial retail price of at least $600.
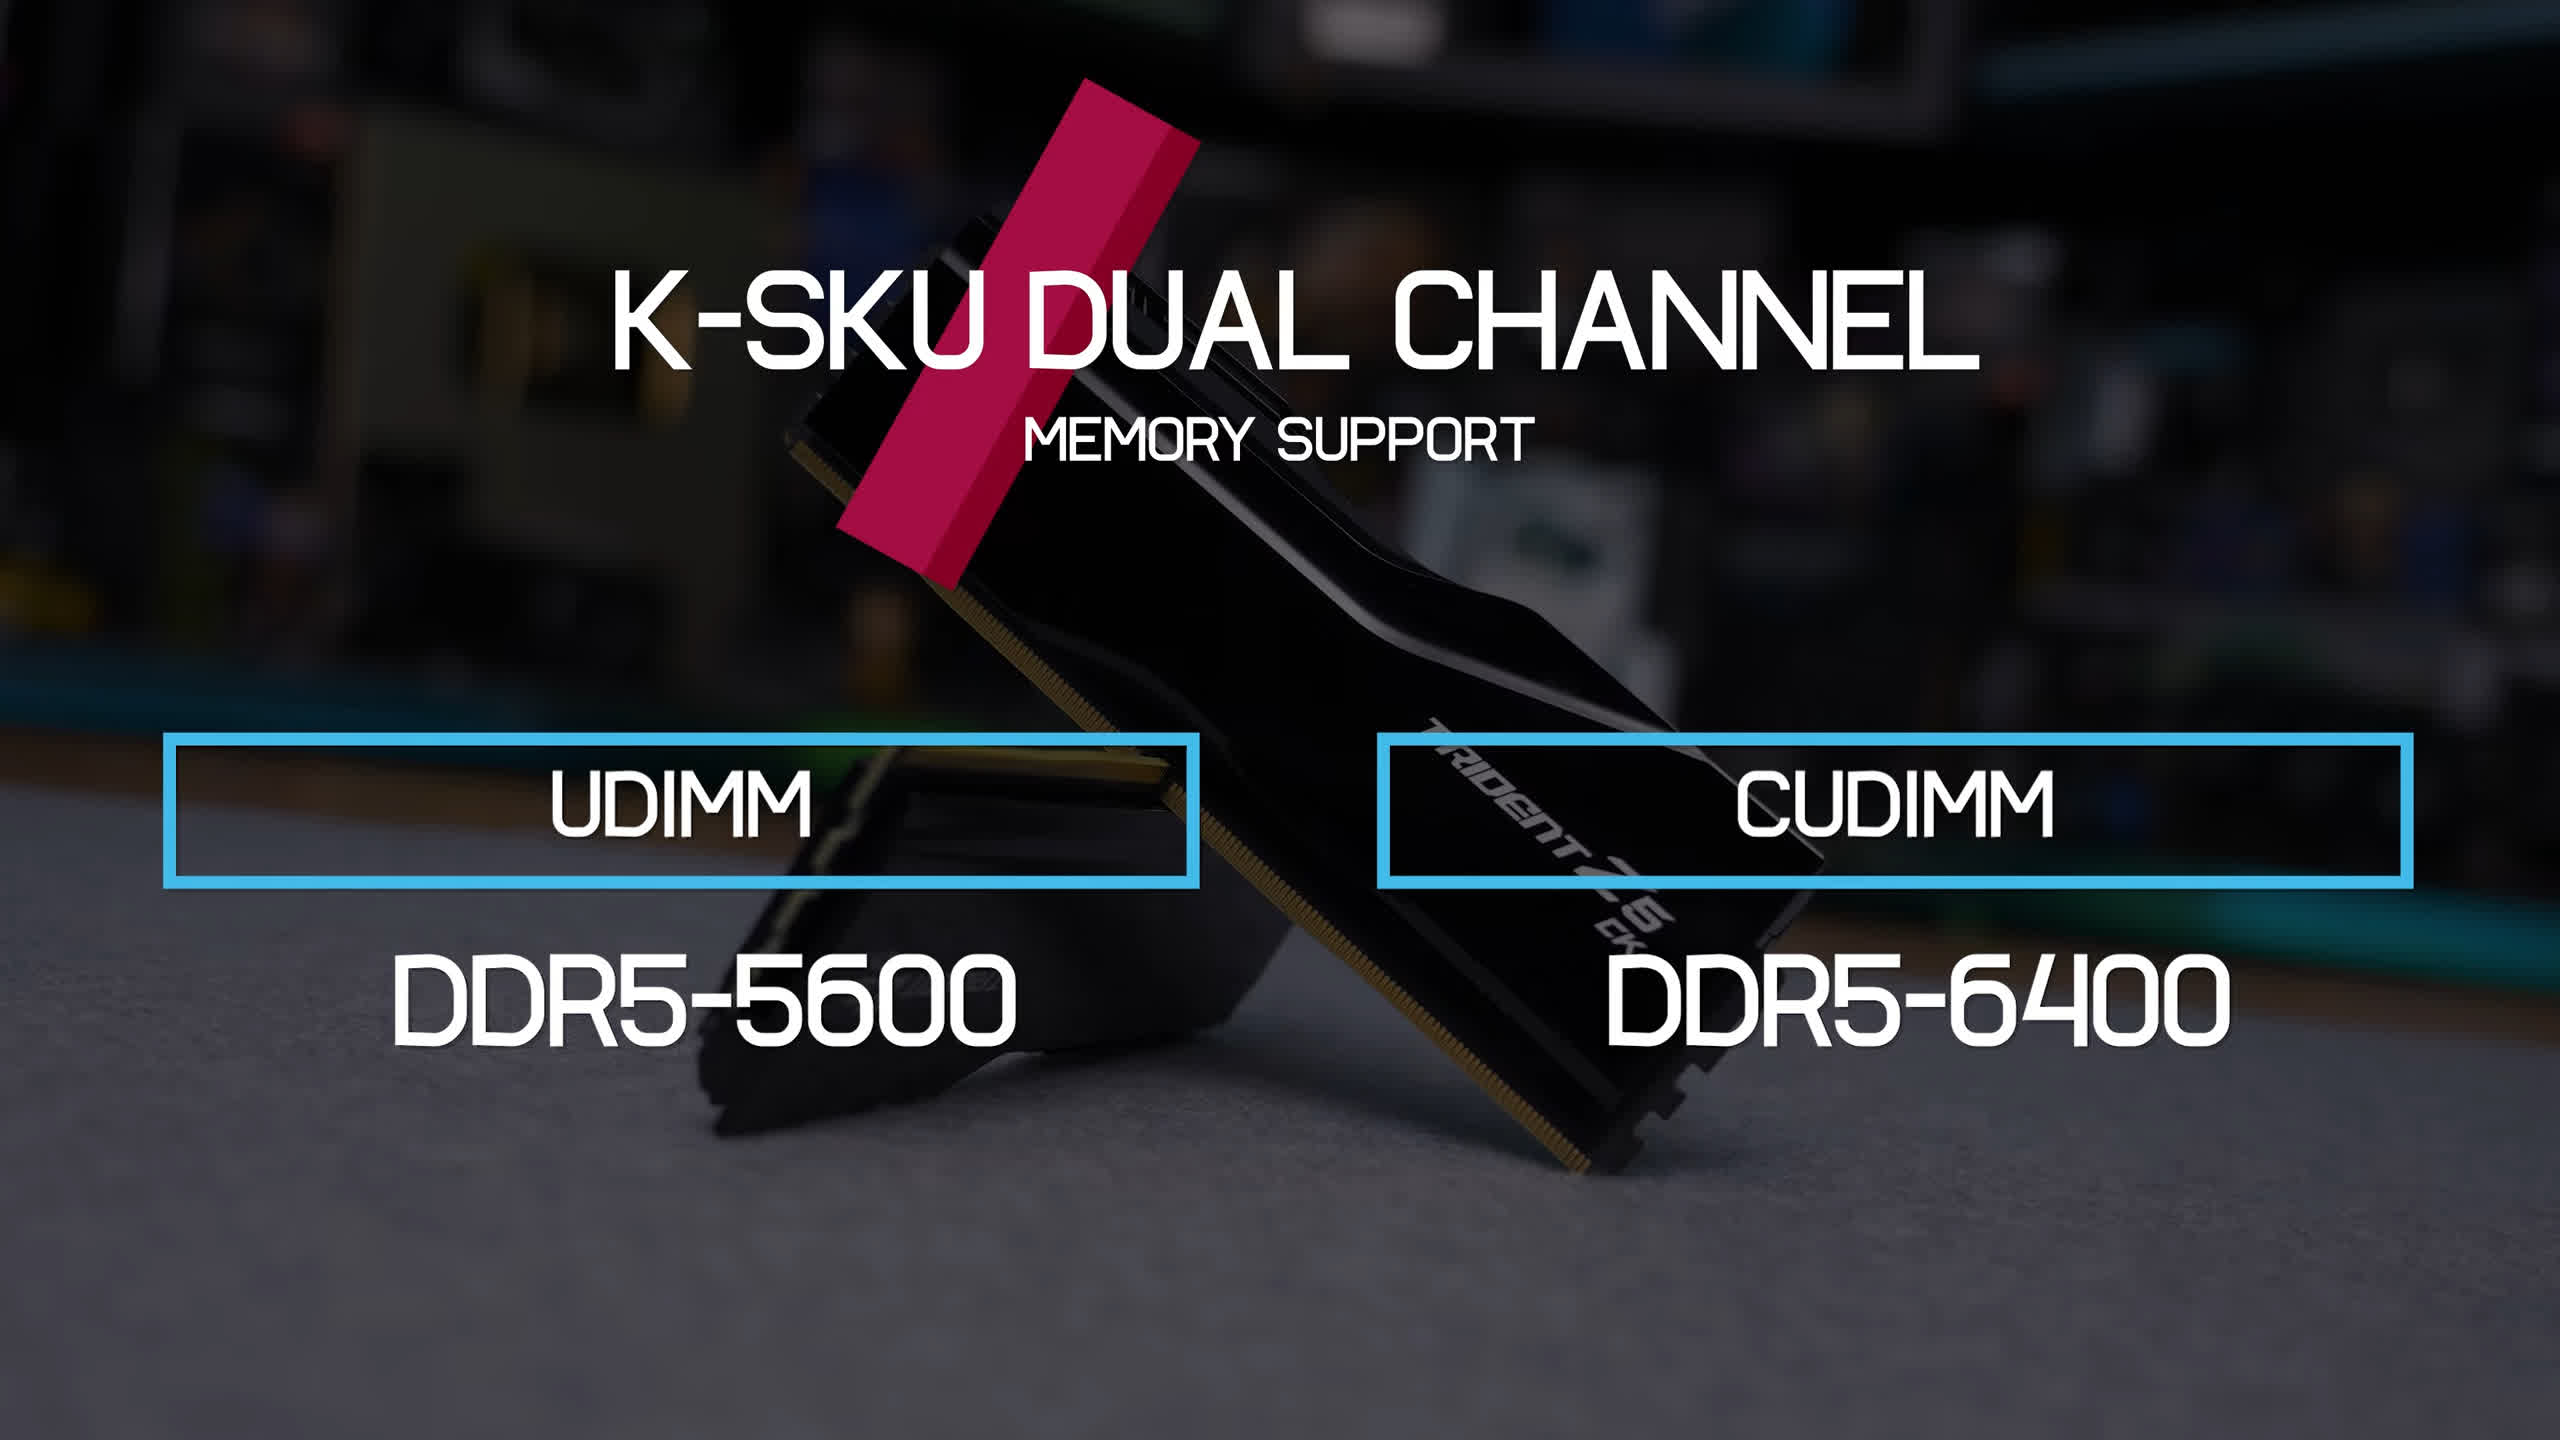
It’s also worth noting that all K-SKU models, which are the only ones announced so far, support dual-channel DDR5-5600 UDIMM memory or DDR5-6400 CUDIMM memory. CUDIMM memory includes a small clock driver circuit directly on the module, enabling more precise timings required at higher memory speeds.
All CPUs provide 20 PCIe 5.0 lanes and 4 PCIe 4.0 lanes, along with an 8-lane Direct Media Interface 4.0 bus to the chipset. As usual, the K-suffix processors have an unlocked multiplier, making them ideal for overclocking.
A New Socket
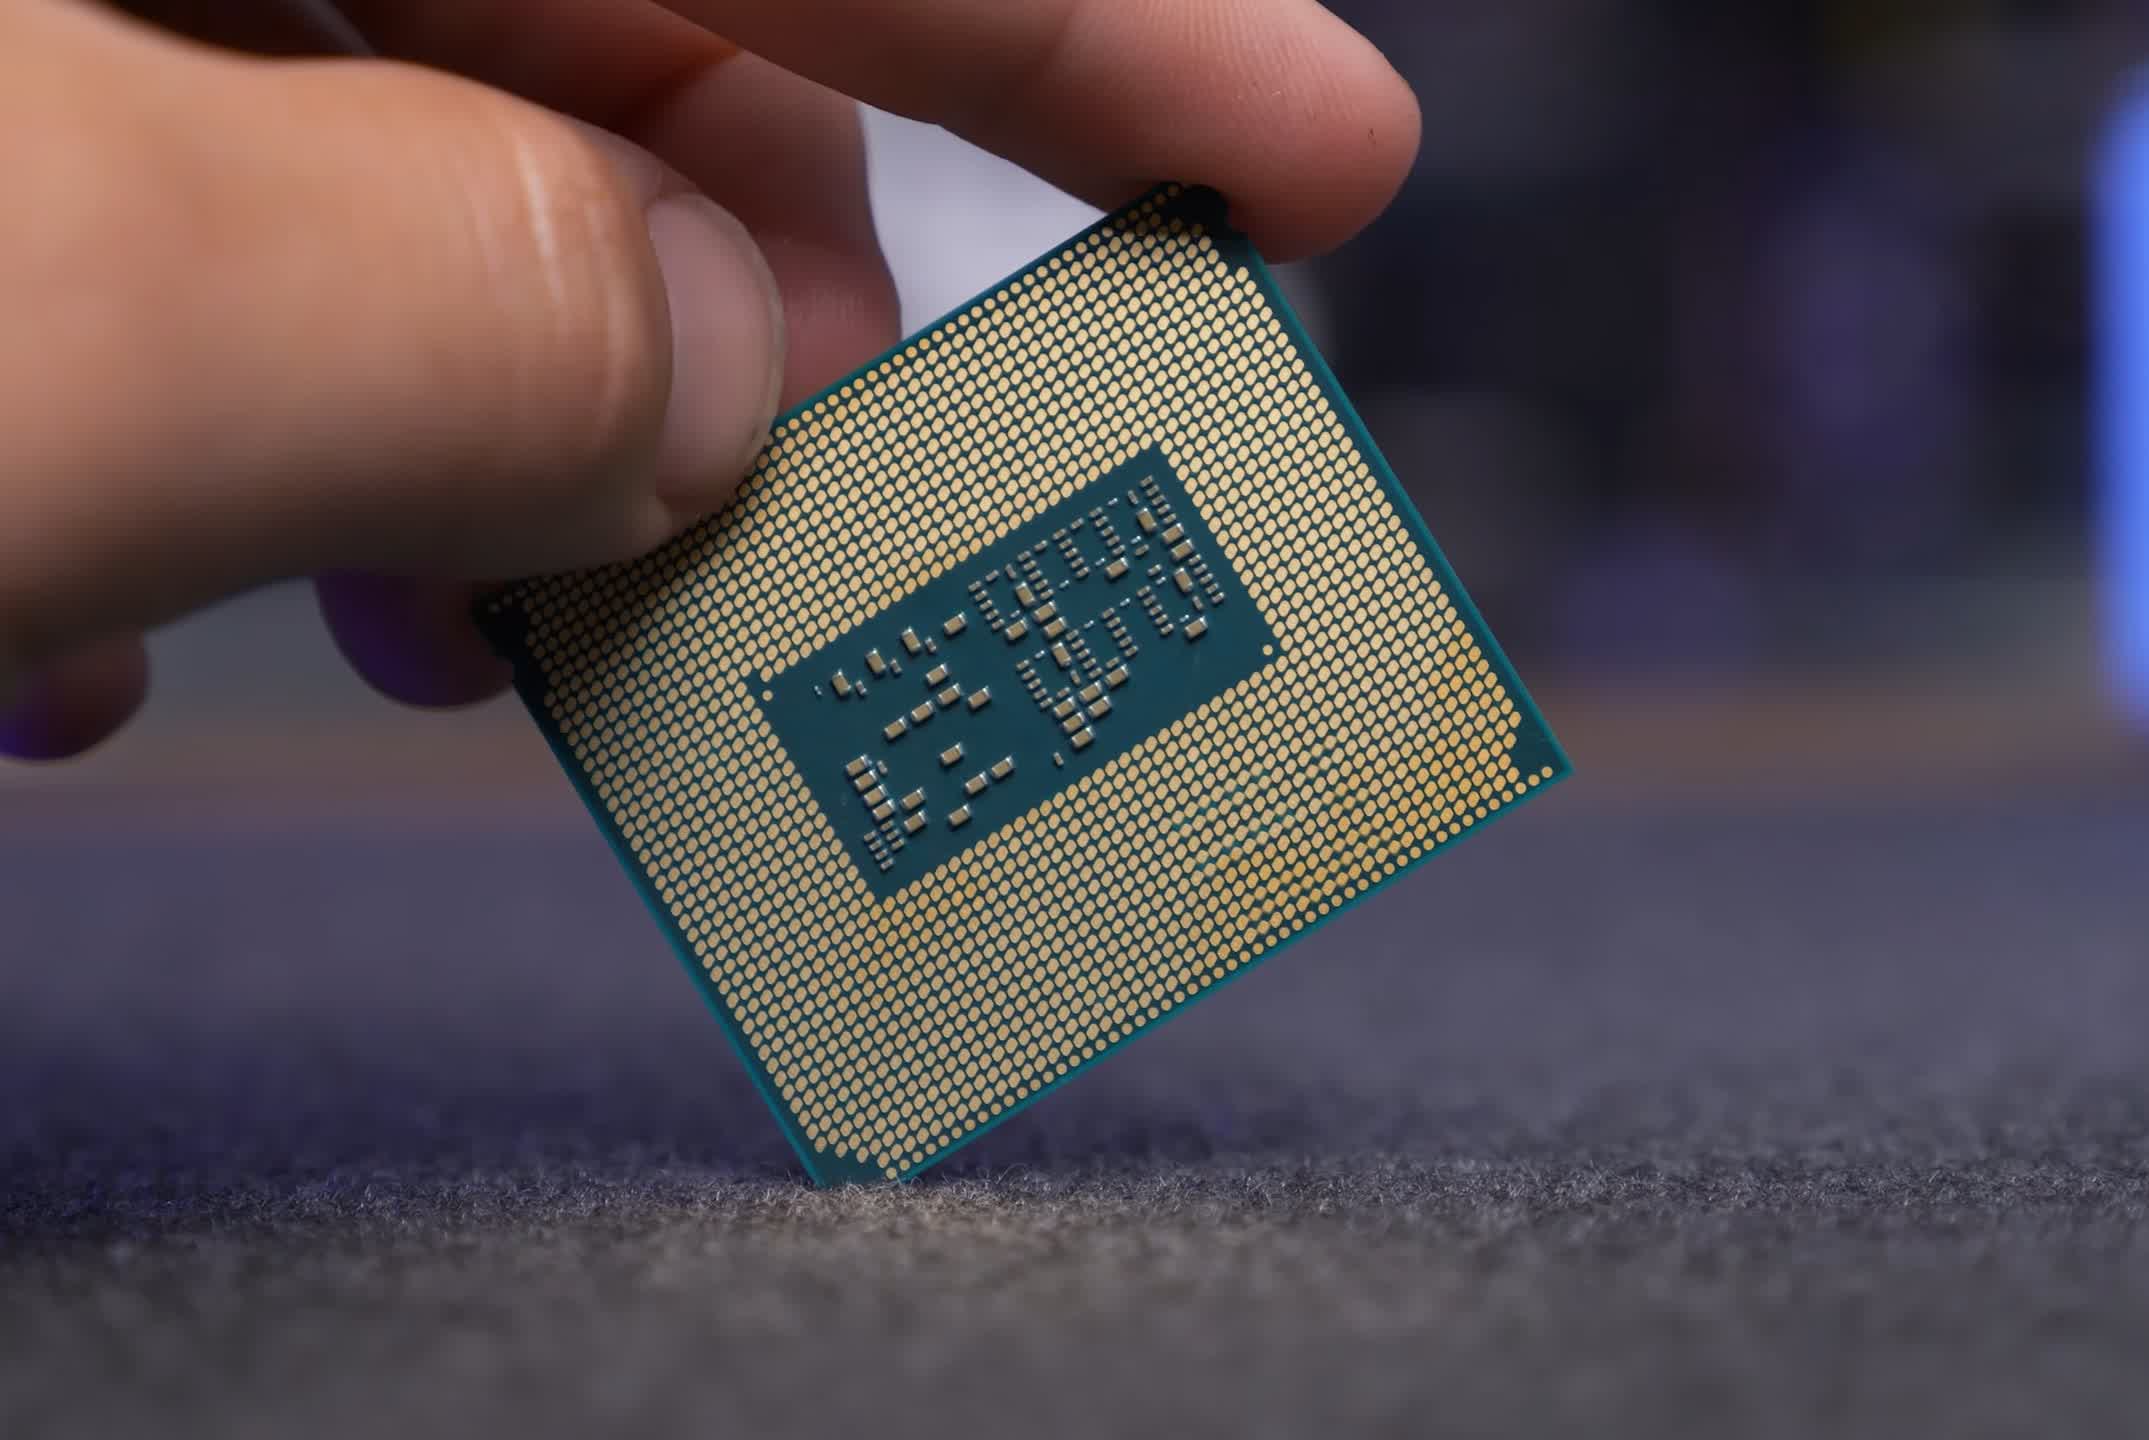
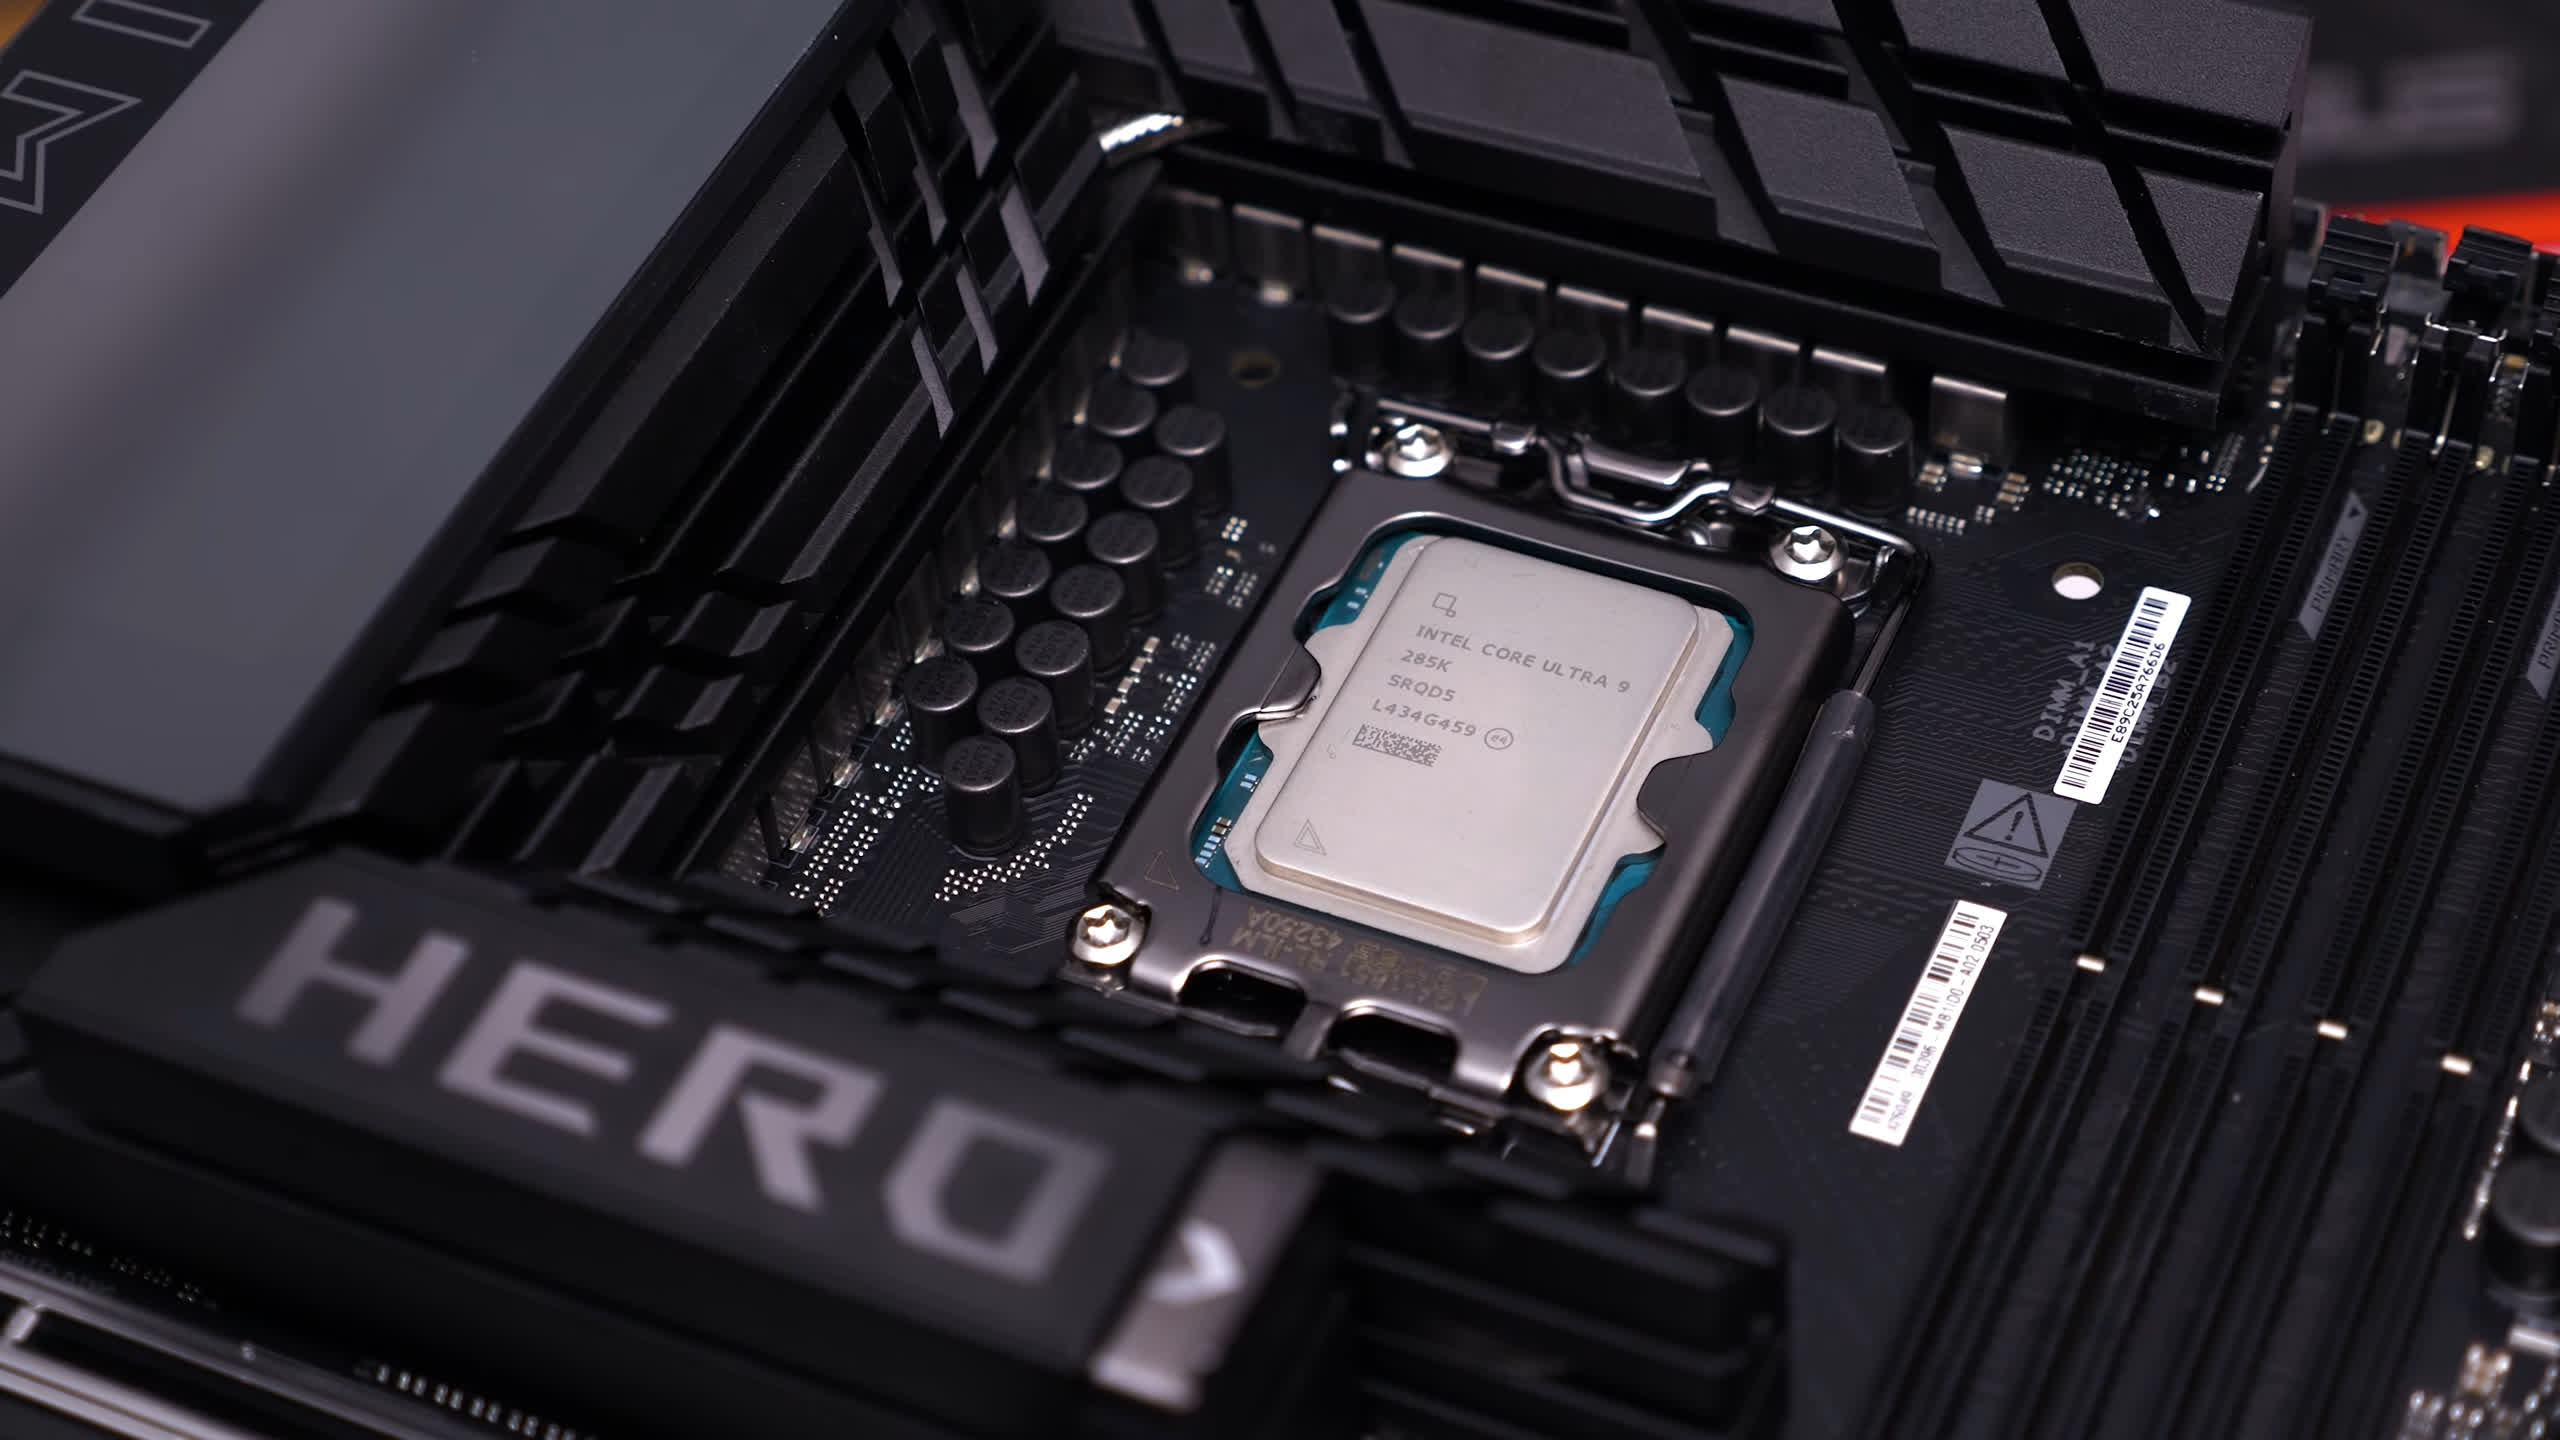
With Arrow Lake, Intel has moved away from the LGA1700 socket, switching to LGA1851. Despite the increased pin count, the new socket maintains the same dimensions and cooler mounting hole spacing as LGA1700, ensuring continued compatibility with existing CPU coolers.
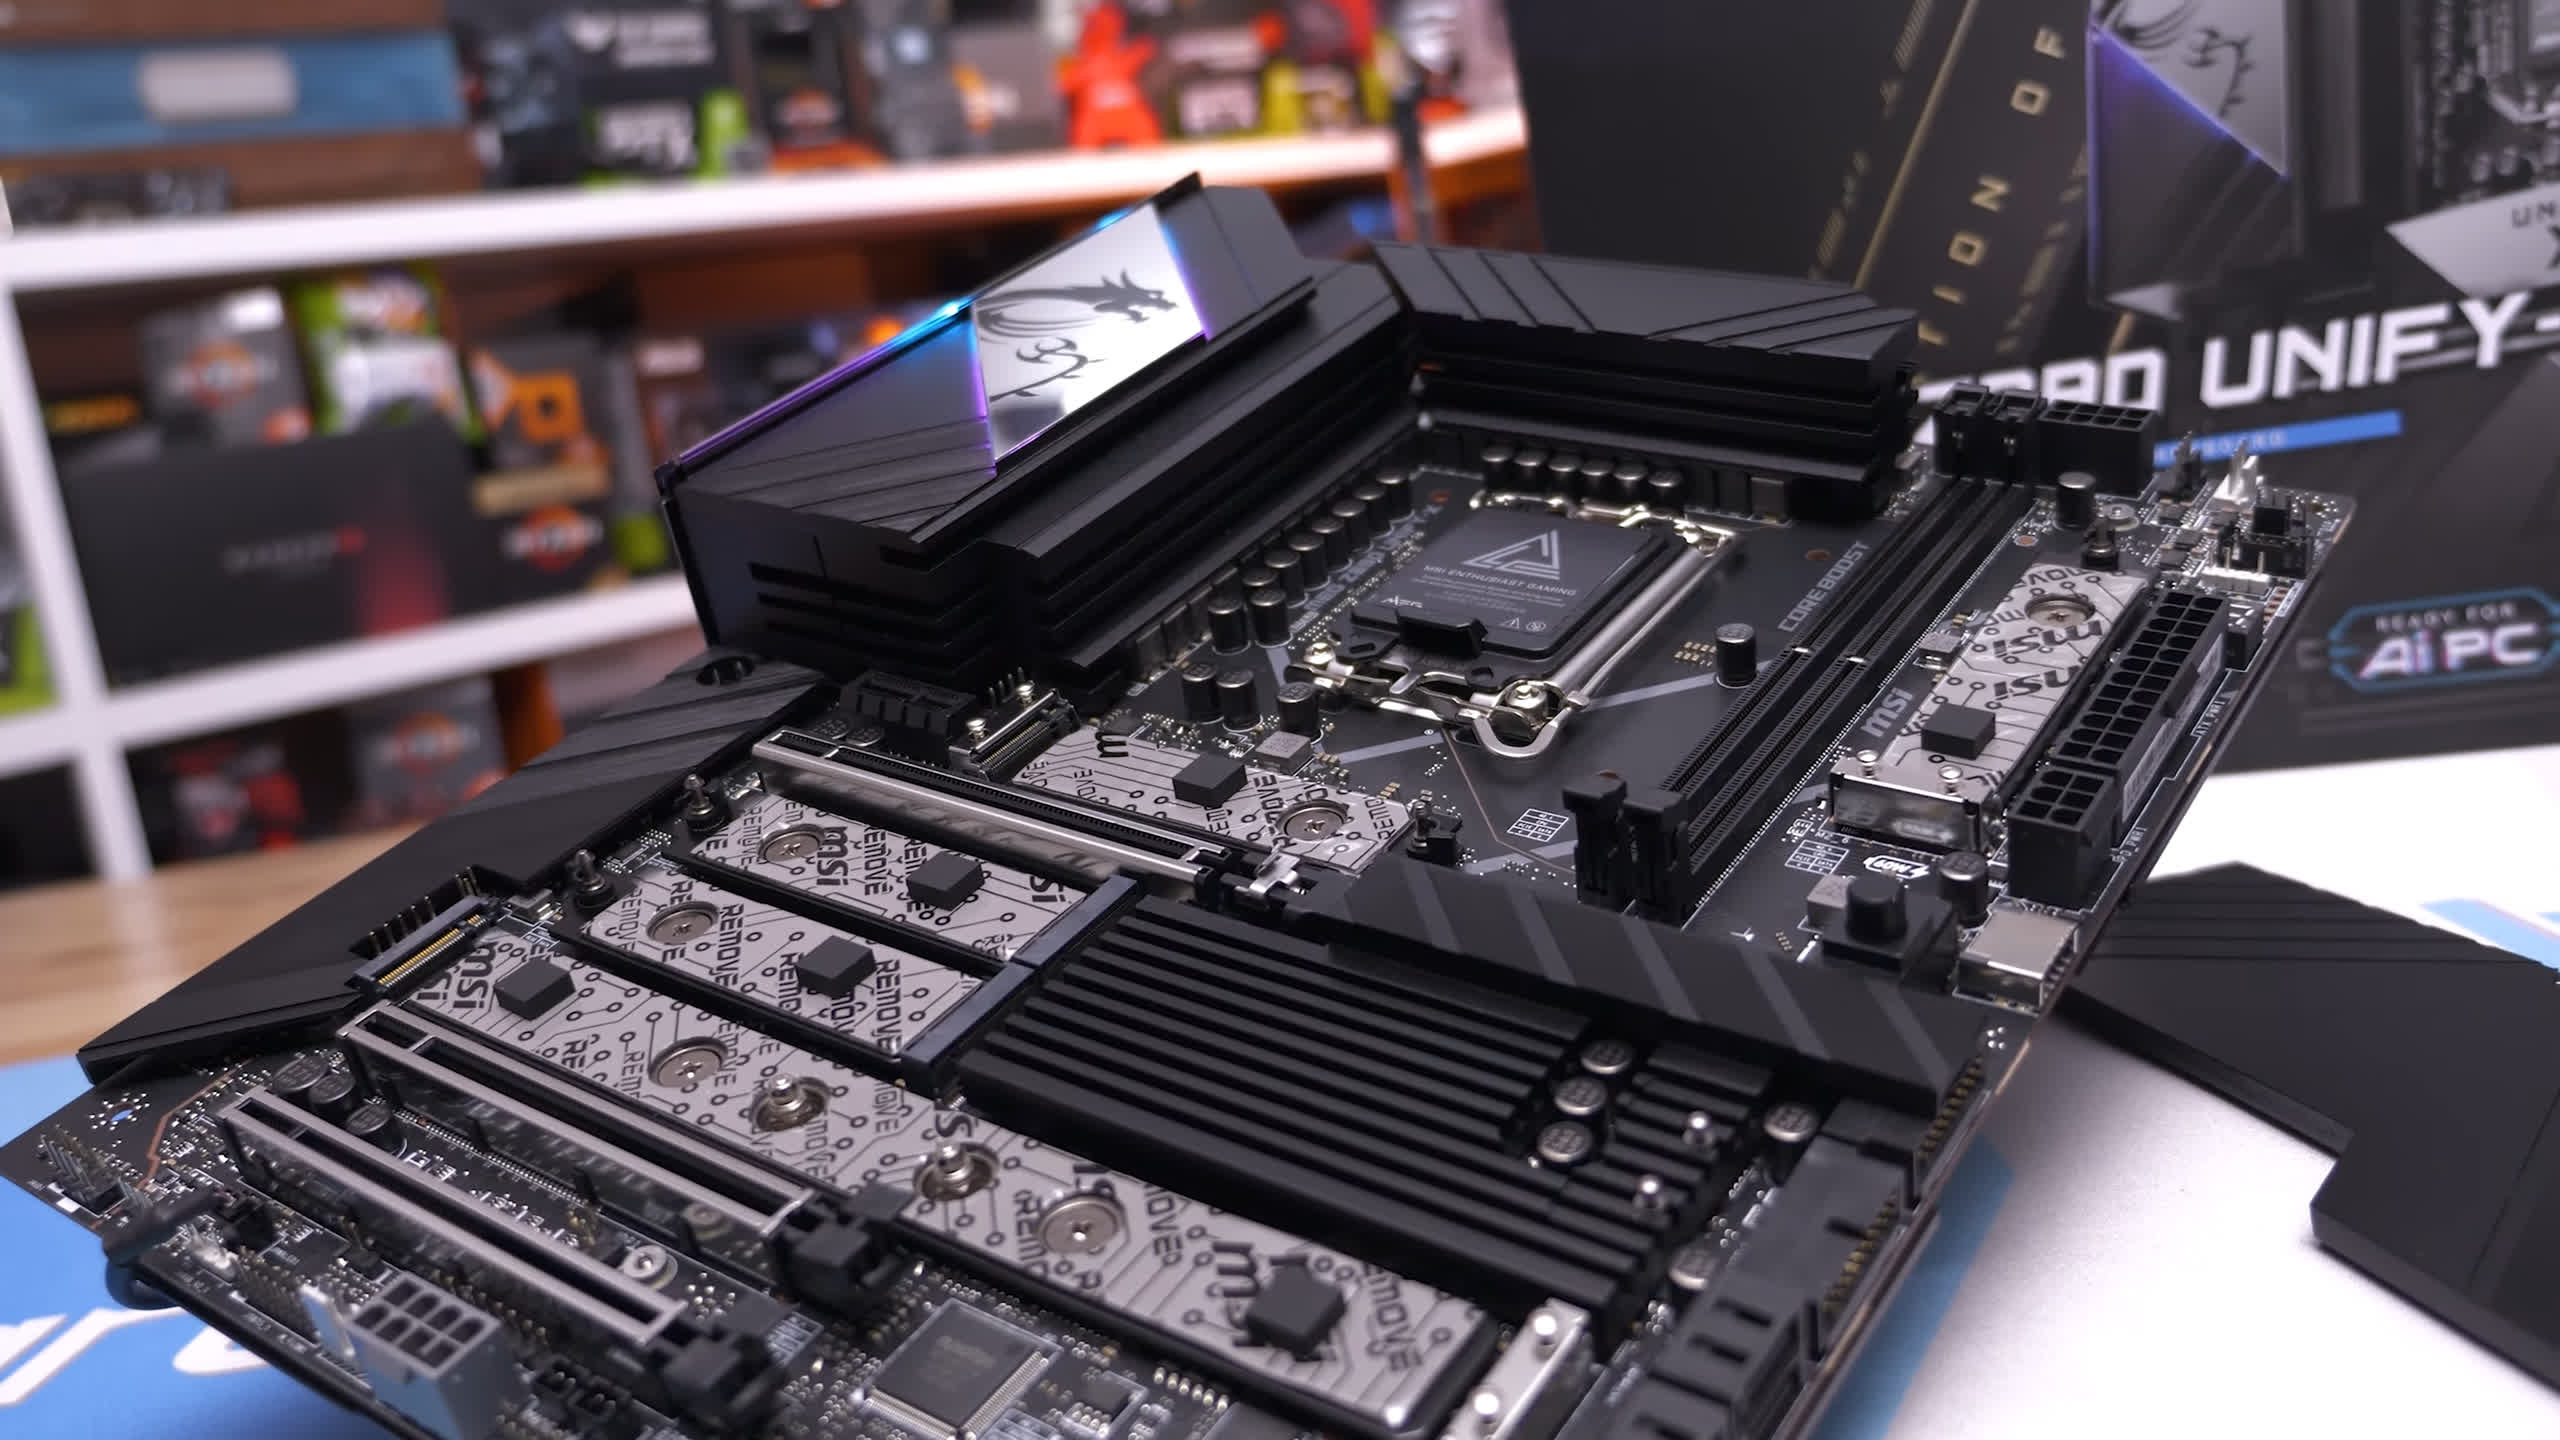
For testing, we used a number of new motherboards, primarily the Asus ROG Maximus Z890 Hero and MSI MEG Z890 Unify-X. A substantial number of BIOS updates were needed to achieve the performance figures we’re about to present, so it’s fair to say the Arrow Lake review process has been far from smooth.
Testing Notes
First, to be transparent, we had very limited time to prepare this review, as Intel only sent us the review kit three days before the embargo lifted. Three days is not enough time to run all the tests we’d like to, so some tests will be covered in follow-up content.
Since these CPUs will be available for purchase on October 24th, we wanted to have a review ready to help guide your buying decisions. However, delays in receiving review samples turned out to be the least of our concerns, as Arrow Lake is currently a bit of a hot mess, so much so that we’re not sure where to start.
Let’s start with Windows 11. Many of you know that Windows 11 24H2 was released a few weeks ago, significantly improving gaming performance for modern Ryzen processors in some cases. It even benefits 13th and 14th-gen Intel models. However, when updating our data, we noticed that 12th-gen Intel CPUs performed noticeably worse on 24H2 compared to 23H2.
This issue wasn’t limited to 12th-gen processors. We encountered serious performance and stability problems with Arrow Lake on 24H2. After multiple fresh installs failed to resolve the issue, we had to revert to testing on 23H2. This is less than ideal, as we know some games perform worse on the older version of Windows 11.
Even with a fresh 23H2 install, we still experienced stability issues with the 285K. Games would occasionally crash, as would certain applications. The problem was worse when using the DDR5-8200 memory provided for testing. This persisted even after numerous BIOS revisions for two different motherboards.
We expect these teething issues will be addressed quickly, though we are unsure why 24H2 caused so many problems. It’s particularly odd because Intel reportedly did all their benchmarking on 24H2 using the Insider Preview build from August and did not report any issues. Nevertheless, we’ve spoken with multiple reviewers who also encountered problems, even with 23H2, and board manufacturers confirmed there are issues with 24H2.
Test System Specs
Before we get into the benchmark data, here are the test specs and systems used. One thing to note is that we benchmarked the 285K with both DDR5-7200 and DDR5-8200 memory.
| CPU | Motherboard | Memory |
| AMD Ryzen 7000 Series | Gigabyte X670E Aorus Master [BIOS F33d] | G.Skill Trident Z5 RGB 32GB DDR5-6000 CL30-38-38-96 Windows 11 24H2 |
| AMD Ryzen 5000 Series | MSI MPG X570S Carbon MAX WiFi [BIOS 7D52v19] | G.Skill Ripjaws V Series 32GB DDR4-3600 CL14-15-15-35 Windows 11 24H2 |
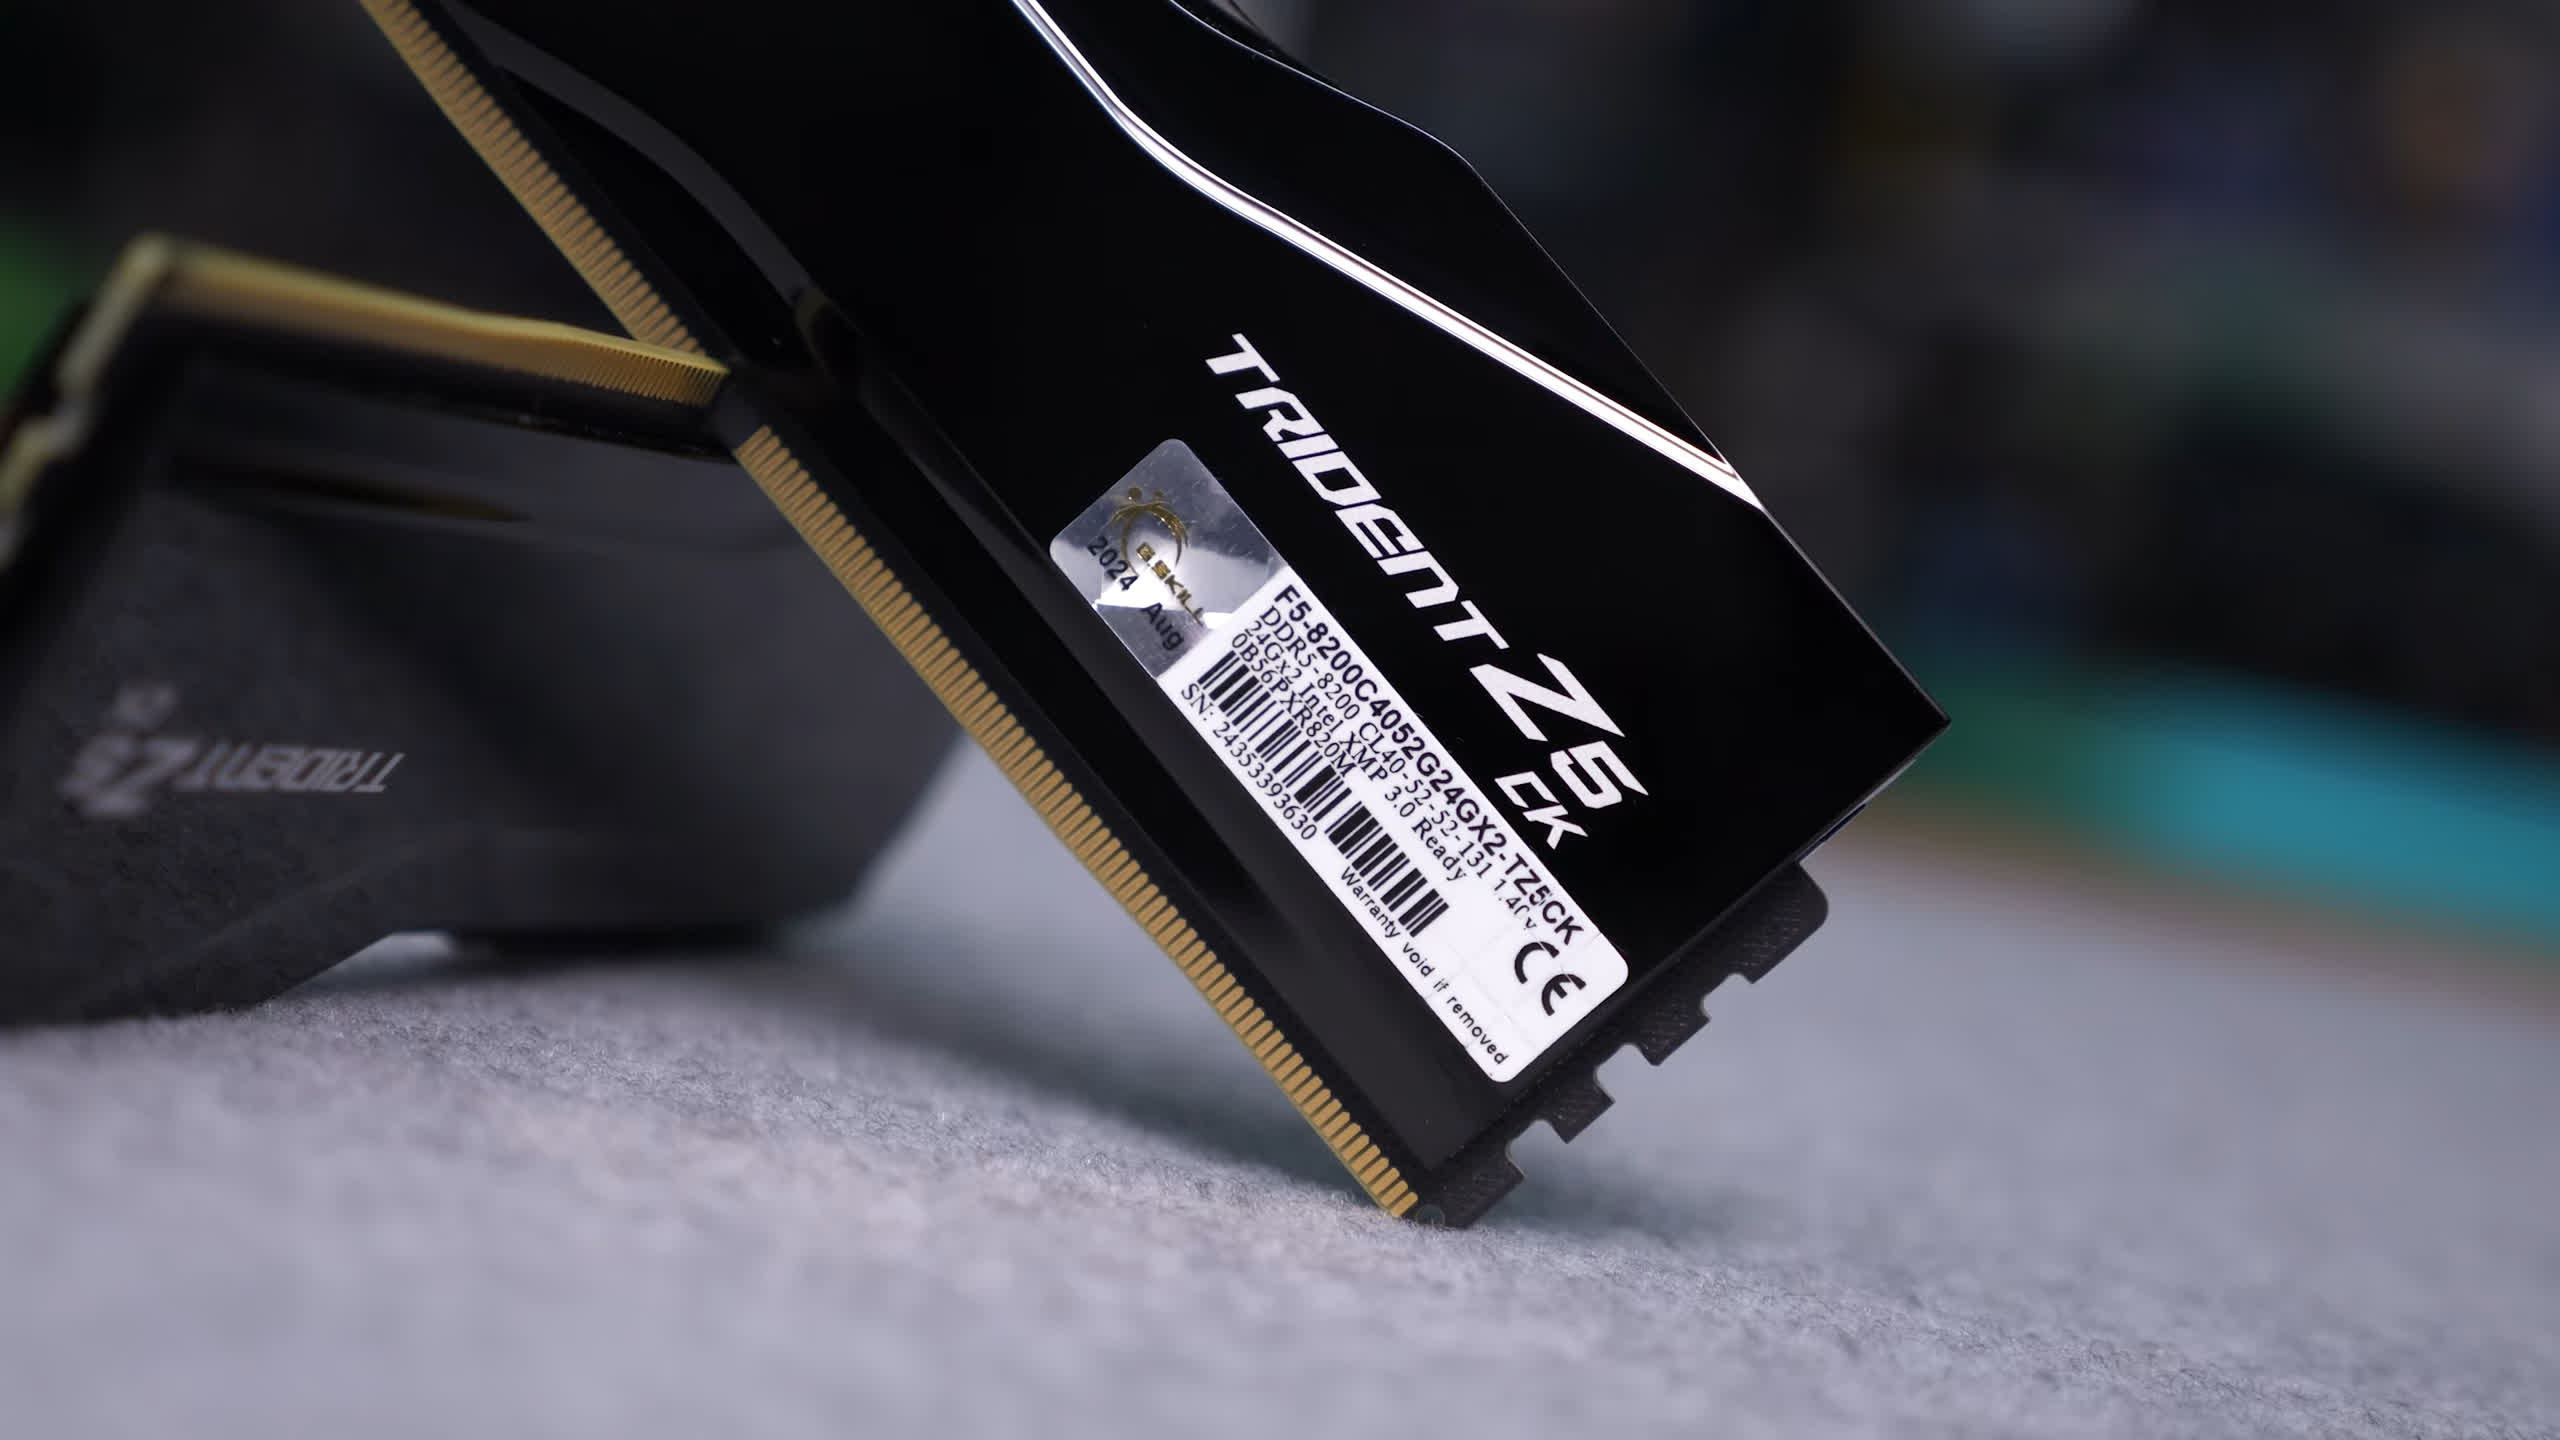
| Intel Core Ultra 200S | Asus ROG Maximus Z890 Hero [BIOS 0805] | G.Skill Trident Z5 CK 32GB DDR5-8200 CL40-52-52-131 G.Skill Trident Z5 RGB 32GB DDR5-7200 CL34-45-45-115 Windows 11 23H2 [24H2 = Slower] |
| Intel 12th, 13th & 14th | MSI MPG Z790 Carbon WiFi [BIOS 7D89v1E] | G.Skill Trident Z5 RGB 32GB DDR5-7200 CL34-45-45-115 Windows 11 23H2 [24H2 = Slower] |
| Graphics Card | Power Supply | Storage |
| Asus ROG Strix RTX 4090 OC Edition | Kolink Regulator Gold ATX 3.0 1200W | TeamGroup T-Force Cardea A440 M.2 PCIe Gen4 NVMe SSD 4TB |
| GeForce Game Ready Driver 565.90 WHQL | ||
The 7200 CL34 memory runs with much tighter timings compared to the DDR5-8200 CL40 memory. If an application or game is more latency-sensitive, the 7200 memory may perform better. However, if bandwidth is the limiting factor, the 8200 kit might have the advantage.
Now, let’s see how the numbers shake out…
Productivity Benchmarks
Cinebench Clock Behavior
First, let’s take a look at how the 285K behaves under load. For cooling, we are using the new MSI MAG Coreliquid I360, which was provided in our review kit and is specifically designed and optimized for the new Arrow Lake CPUs.
MSI has developed a unique bracket that shifts the cold plate north, resulting in a 3-degree reduction in temperature as it better targets the hotspot on these new CPUs. A nice feature of this design is that the unique mounting bracket also provides optimal coverage for LGA1700, AM4, and even AM5 processors, making it a versatile, one-size-fits-all solution.
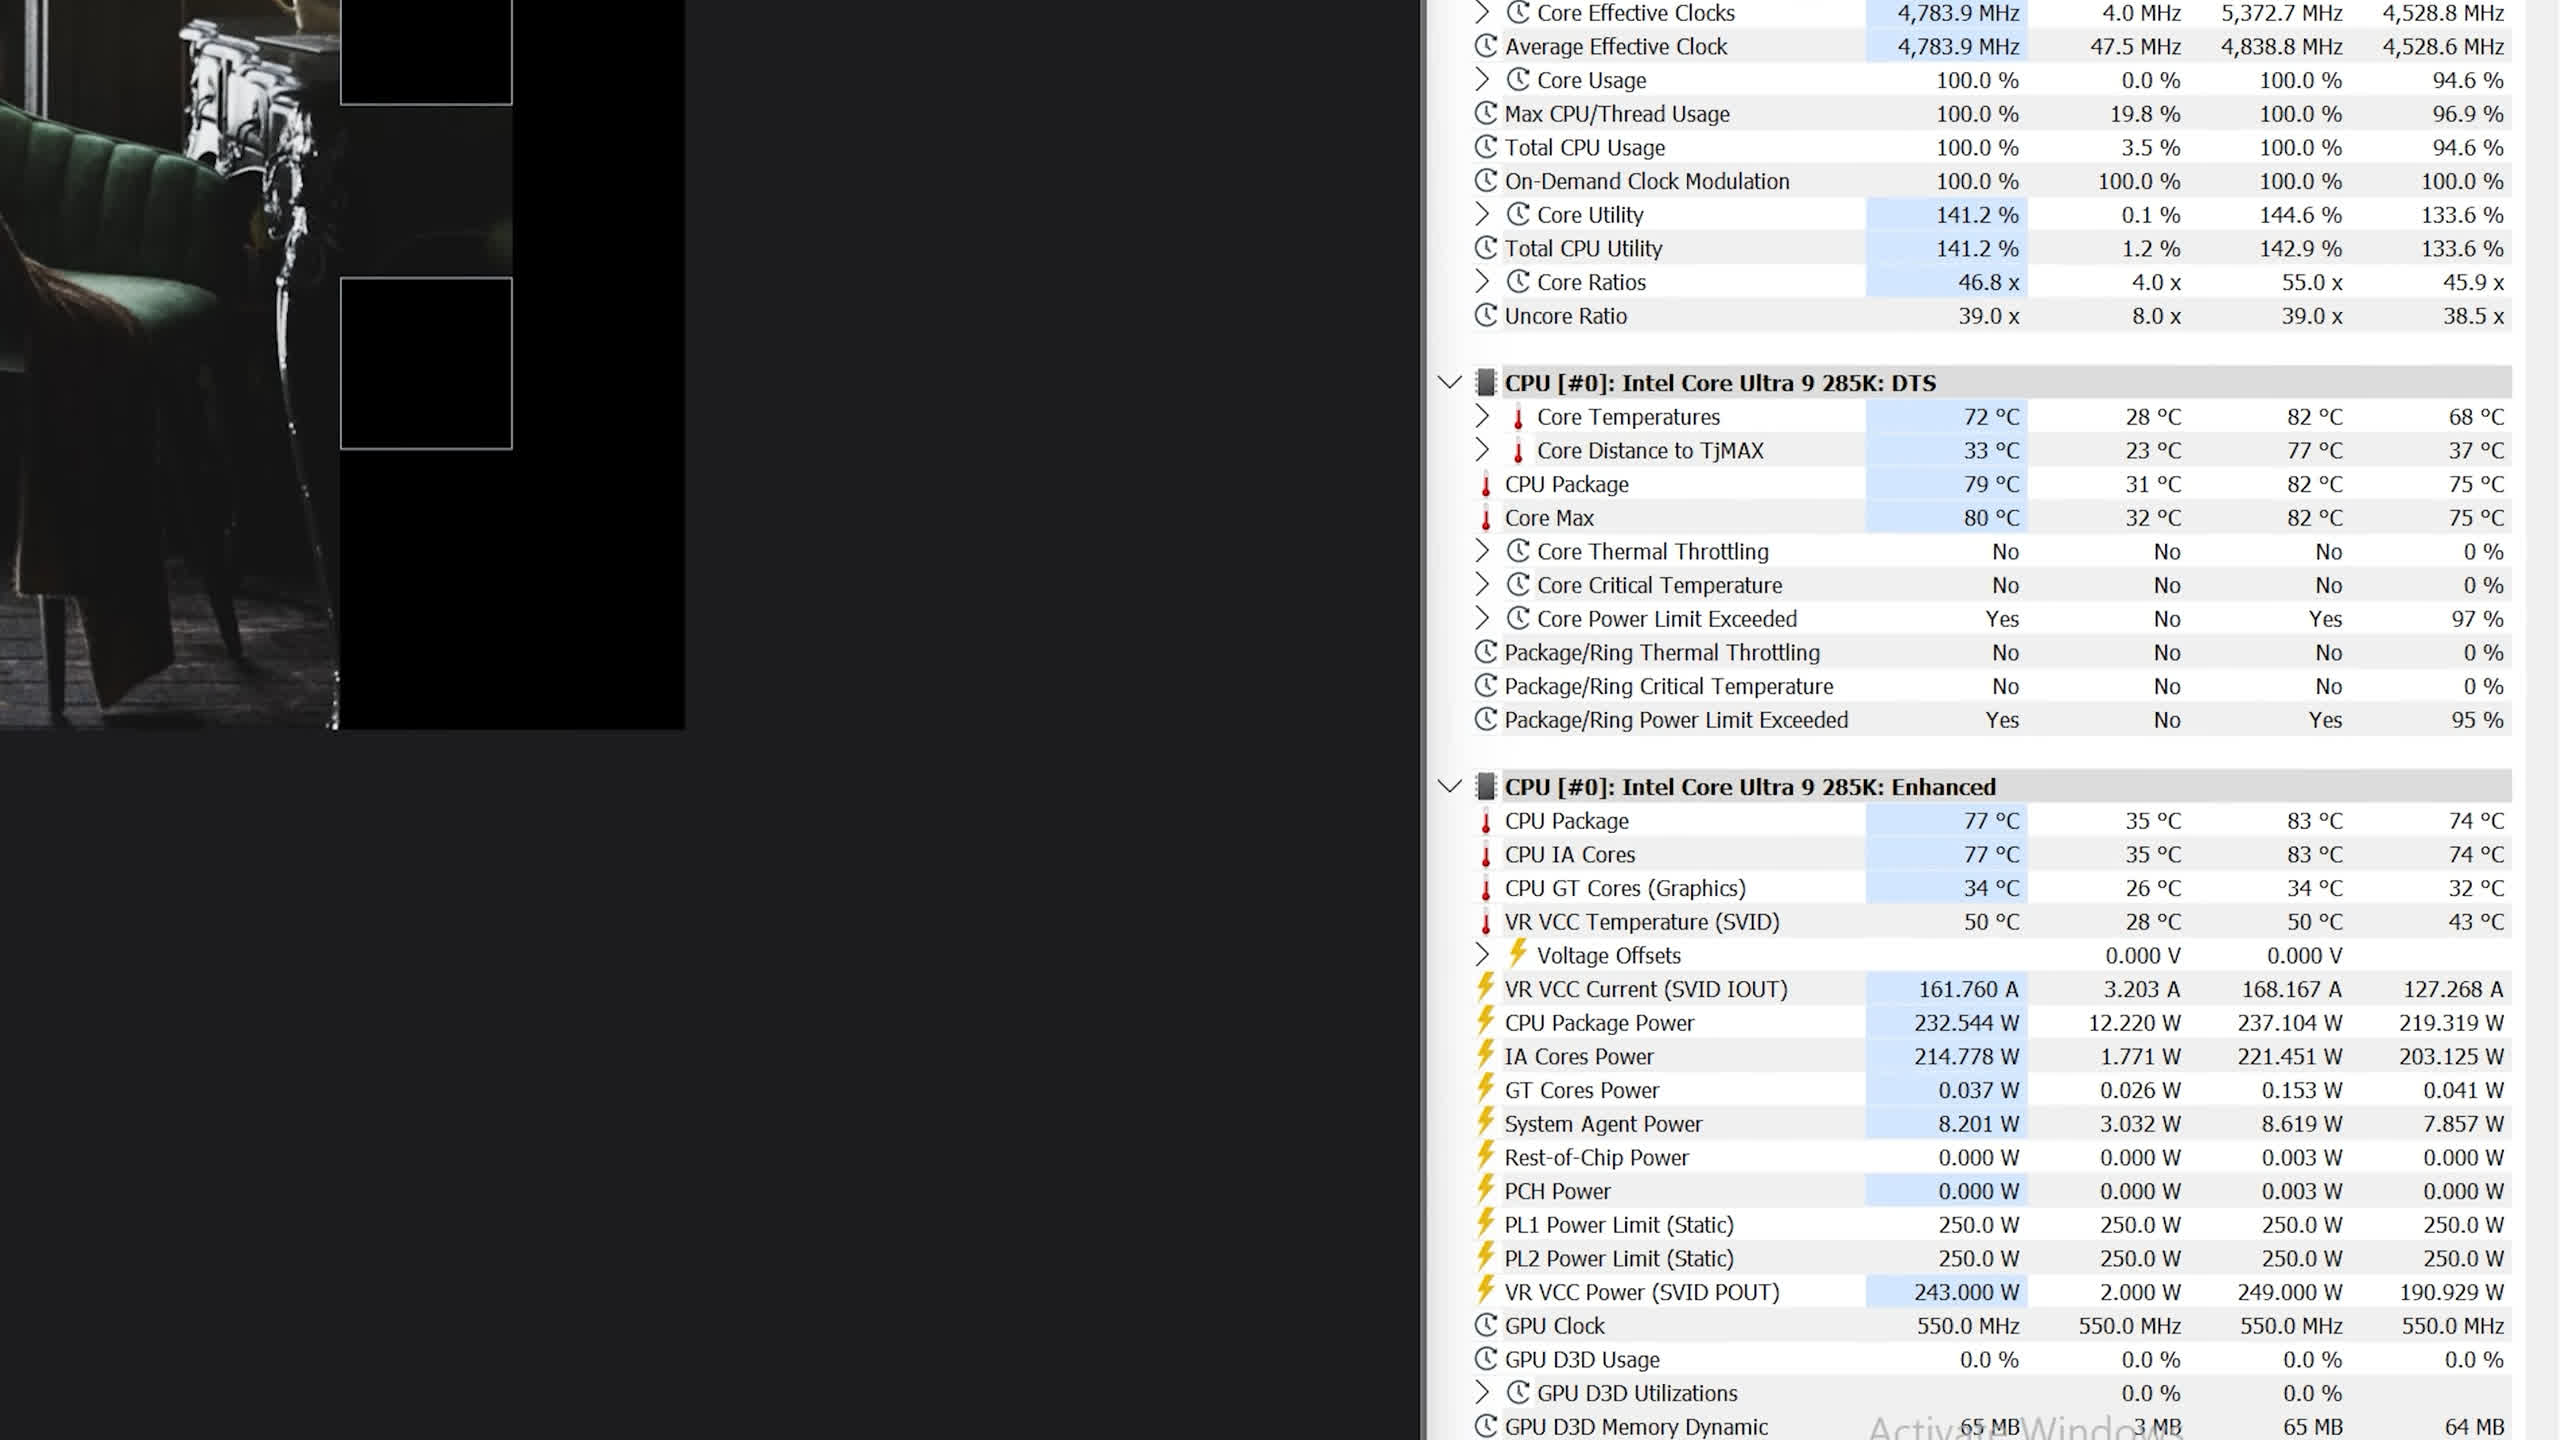
With the Coreliquid I360 installed, we loaded up the 285K with Cinebench and observed an average clock frequency of 4.6 GHz on the E-Cores and 5.3 GHz on the P-Cores, all while staying within the stock 250W power limit. The CPU reached a peak core temperature of 84°C, which is well below the 105°C TjMAX.
Cinebench 2024, Multi Core
Now for the benchmark graphs: the Cinebench multi-core performance looks very strong. We already know that E-Cores work well in this type of workload, based on previous models. The E-Cores in the 285K are based on an updated architecture and run at slightly higher clock speeds. Using either DDR5-7200 or 8200 memory, we saw a score of just over 2,500 points, making the 285K 14% faster than the 14900K and 7% faster than the 9950X.
Cinebench 2024, Single Core
When we look at single-core performance, the Arrow Lake P-Cores continue to impress, with the 285K being 13% faster than the 14900K and 6% faster than the 9950X – another great result.
Cinebench 2024 Power Consumption
Next, let’s discuss power consumption. This part of the review gave us some trouble, but thanks to Steve from Gamers Nexus, we were able to catch an issue with the testing. The Asus ROG Maximus Z890 Hero has a unique design: instead of delivering all the CPU power through the dual EPS12V rails, four of the vCore power stages are connected to the 24-pin ATX power cable.
Initially, we were puzzled as to why the 285K, with a 250W limit, was drawing only 196W. After Gamers Nexus alerted us to this, we confirmed that about 50-60W of power was being supplied via the 24-pin ATX cable. This was later confirmed by Asus engineers.
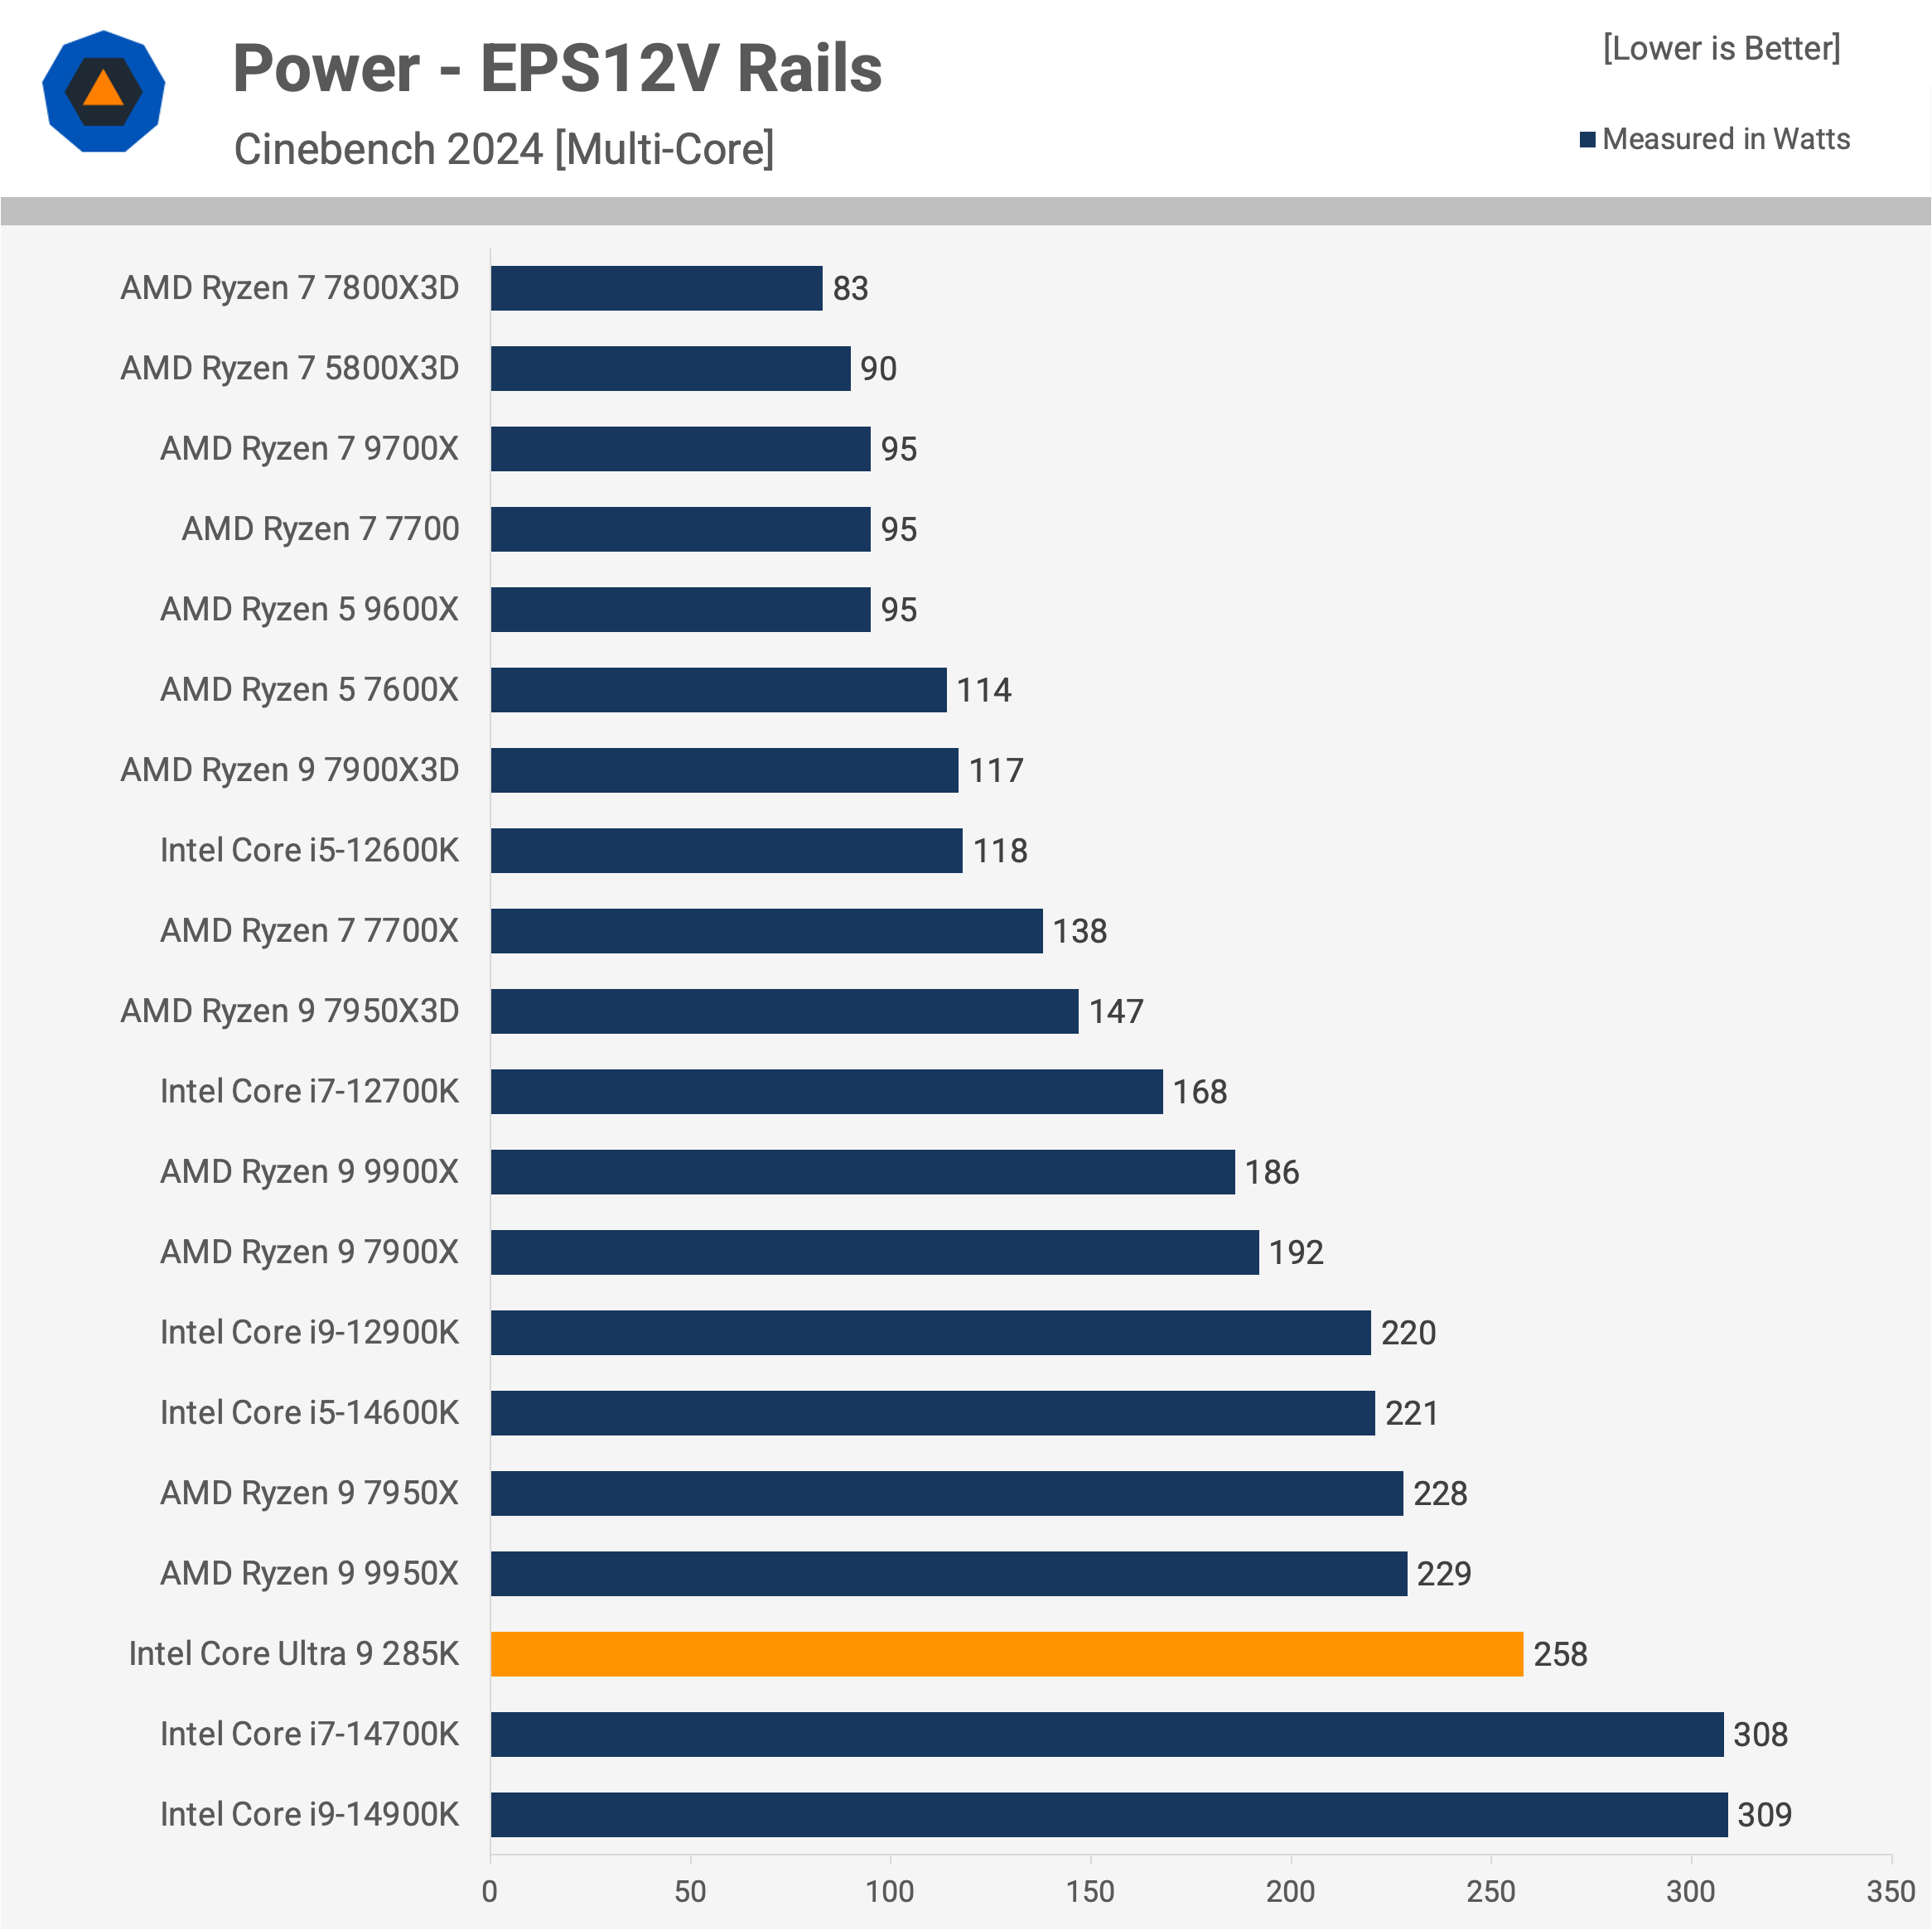
After retesting with the MSI MEG Z890 Unify-X, we confirmed the correct EPS12V data, showing the 285K drawing 258W during this test. While this is an improvement over the 14900K, it’s not particularly impressive, considering the 9950X was only 7% slower but consumed 11% less power. Even more concerning is that the 7950X3D was just 13% slower than the 285K but used a massive 43% less power.
However, compared to the highly inefficient 14900K, the 285K represents a step in the right direction, consuming 17% less power while delivering 14% more performance.
7-Zip File Manager Compression
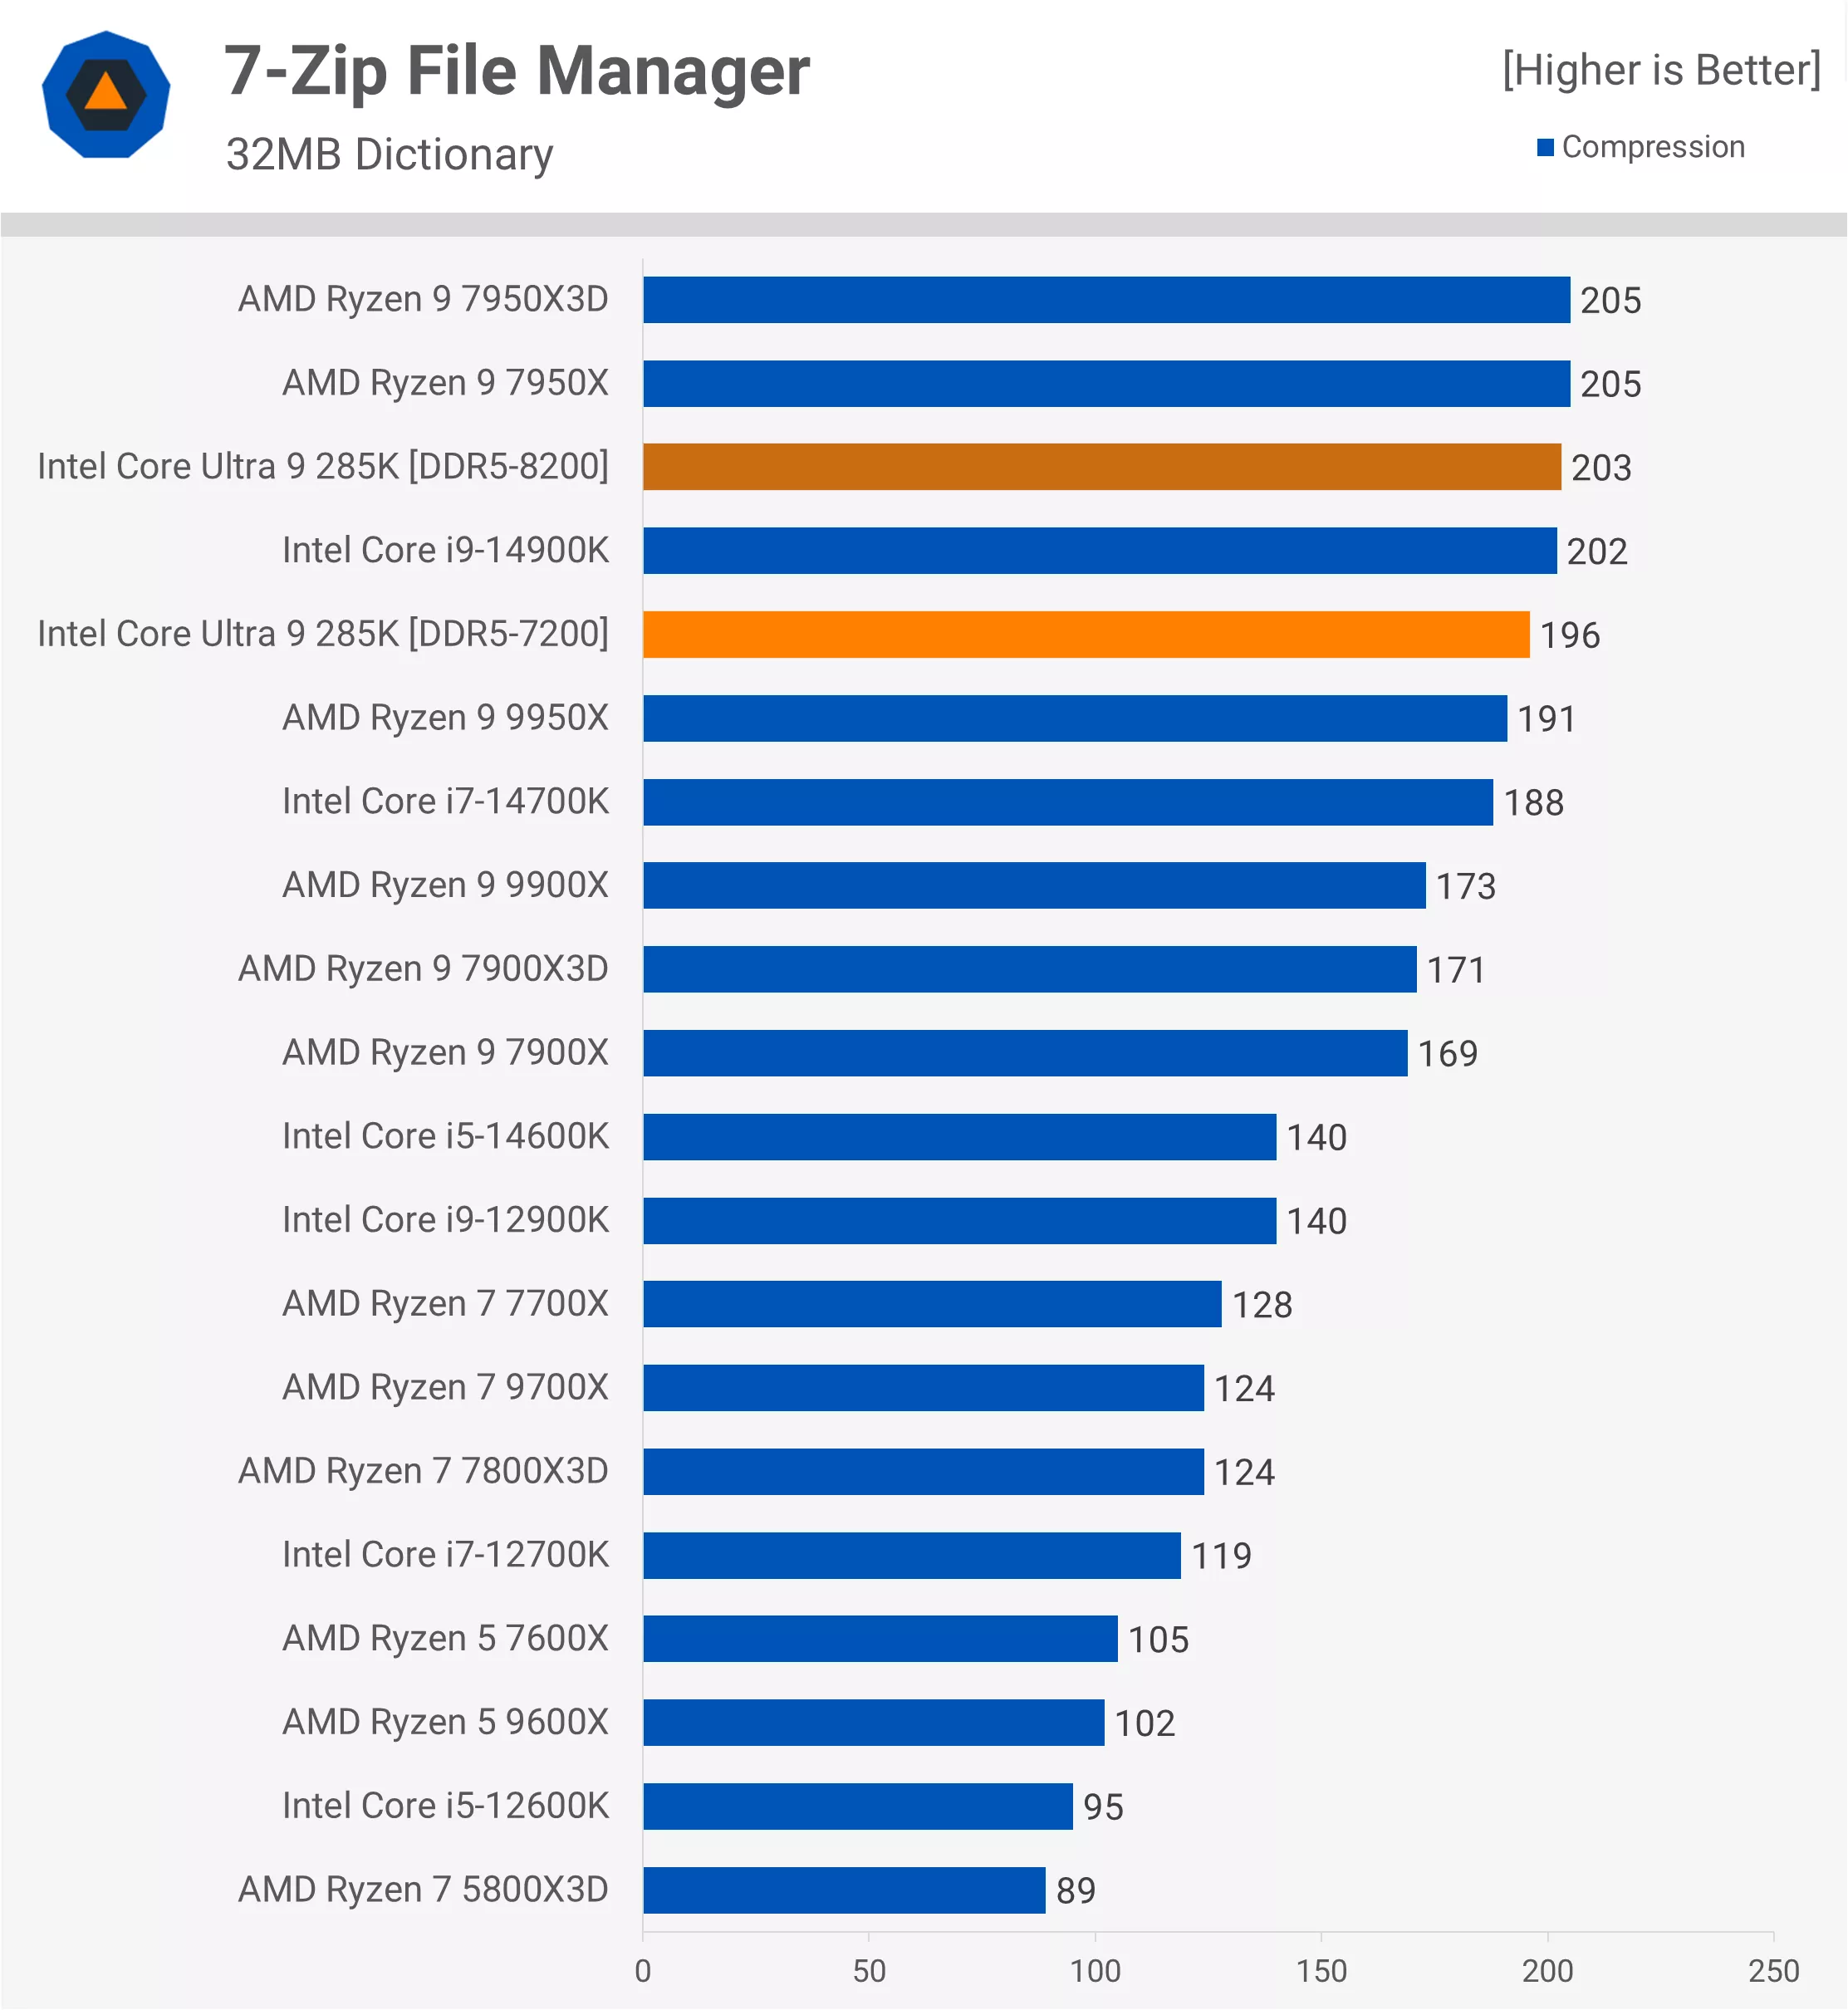
When it comes to compression performance, the 285K is solid, but not groundbreaking. It performs similarly to the 14900K, 9950X, and 7950X. While it’s not a huge leap forward for a new generation, it’s certainly not a bad result.
7-Zip File Manager Decompression
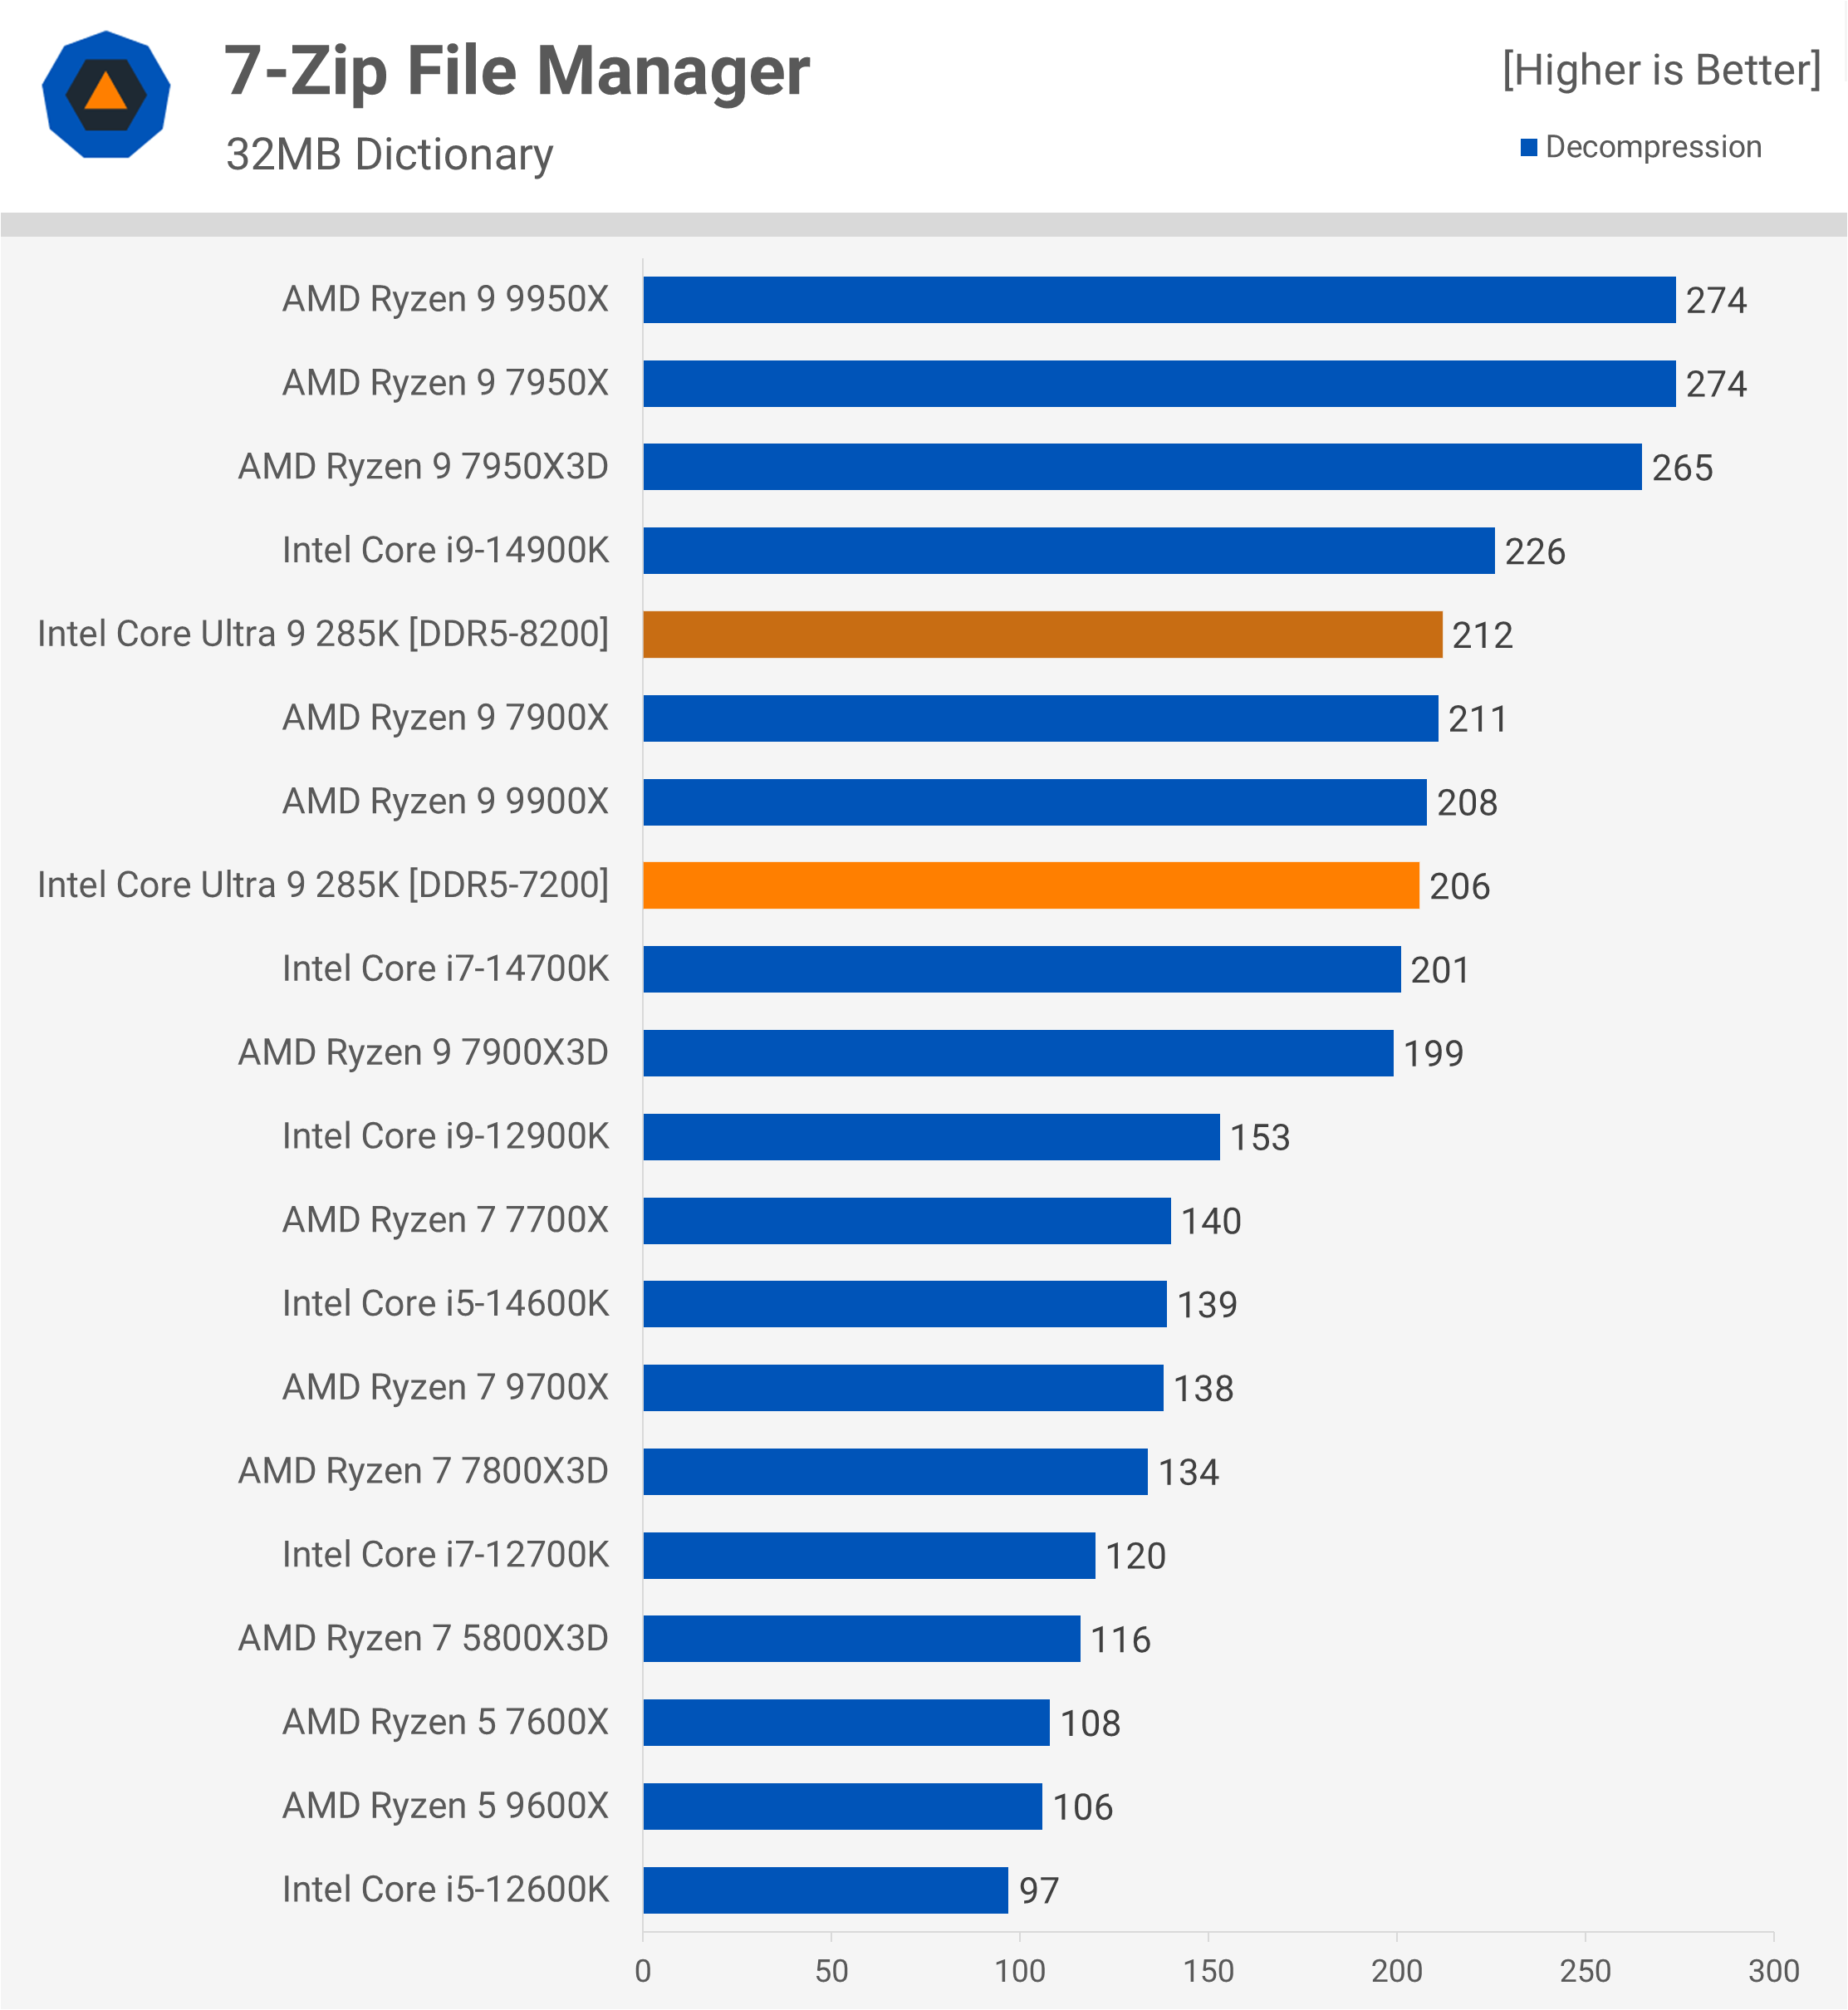
However, decompression performance is quite weak, largely due to the removal of SMT. As a result, when using the same frequency memory, the 285K is 9% slower than the 14900K and a significant 25% slower than the 9950X.
Blender Open Data
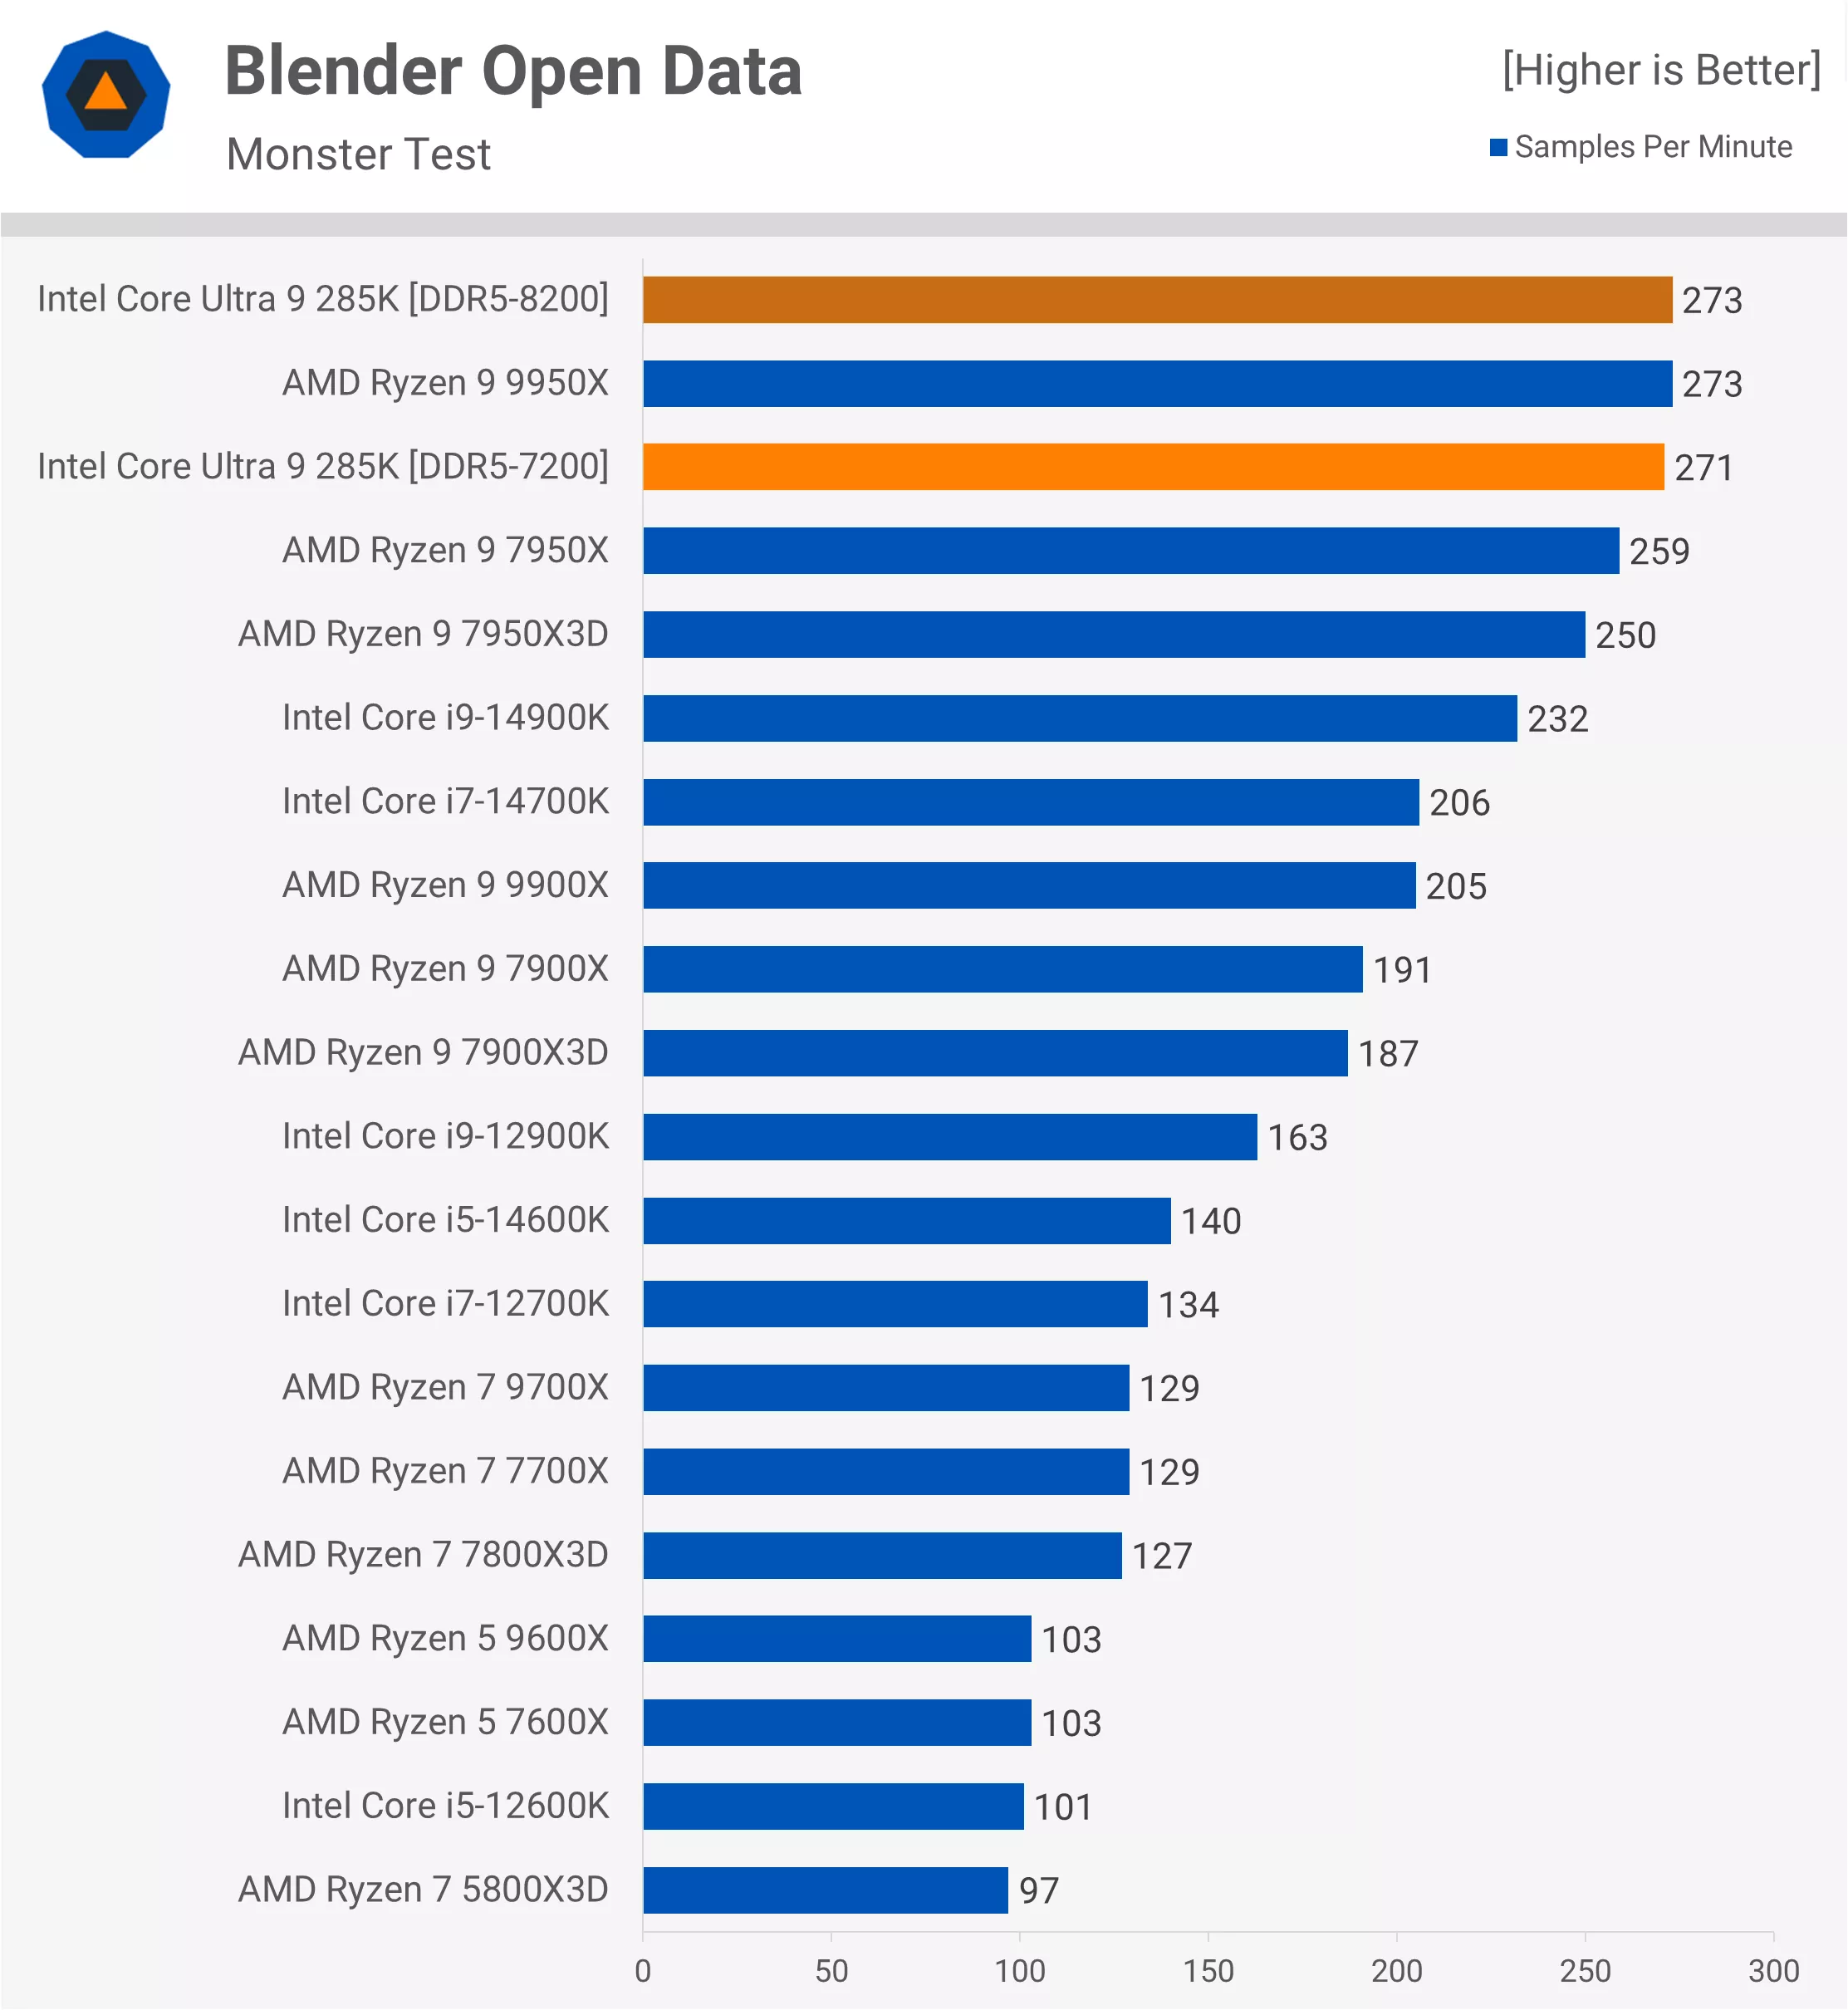
The Blender Open Data results are good, though not exceptional, as the 285K matches the 9950X. However, given the improved power efficiency, this is still a positive outcome overall.
Corona 10 Benchmark
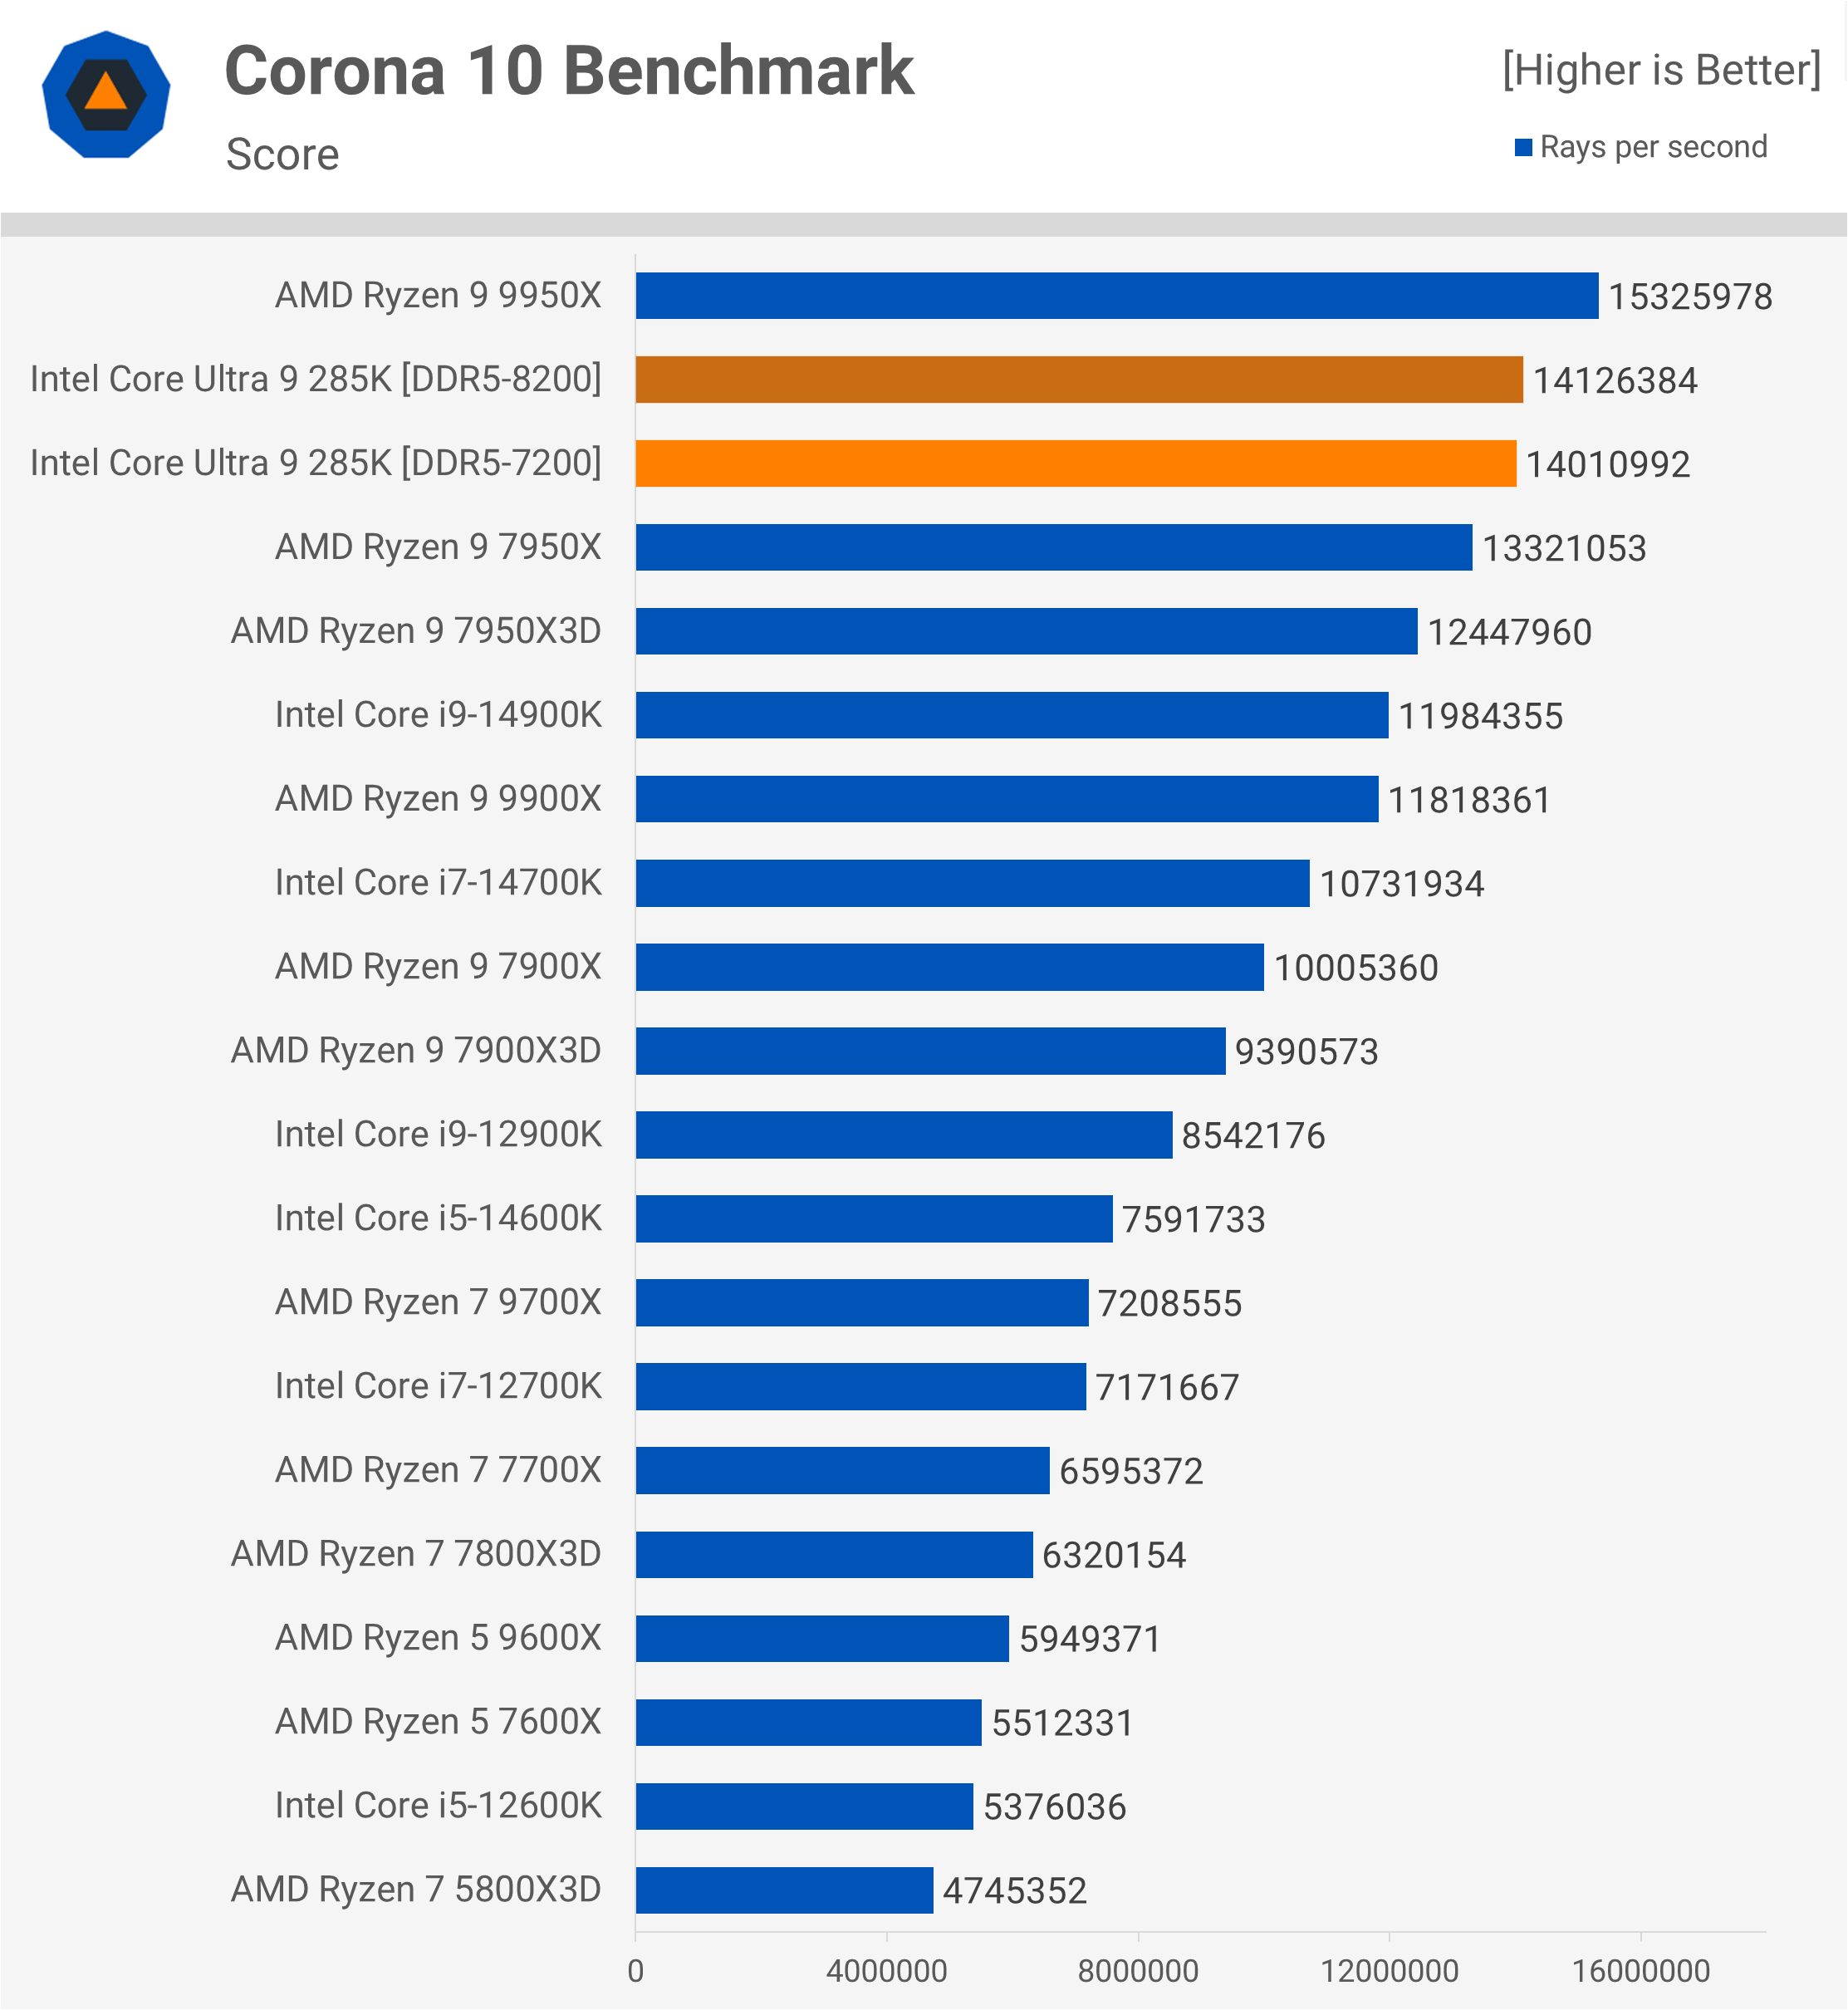
In the Corona 10 Benchmark, the 285K performs well, though it’s 9% slower than the 9950X, despite showing a 17% performance increase over the 14900K.
Adobe Photoshop 2025
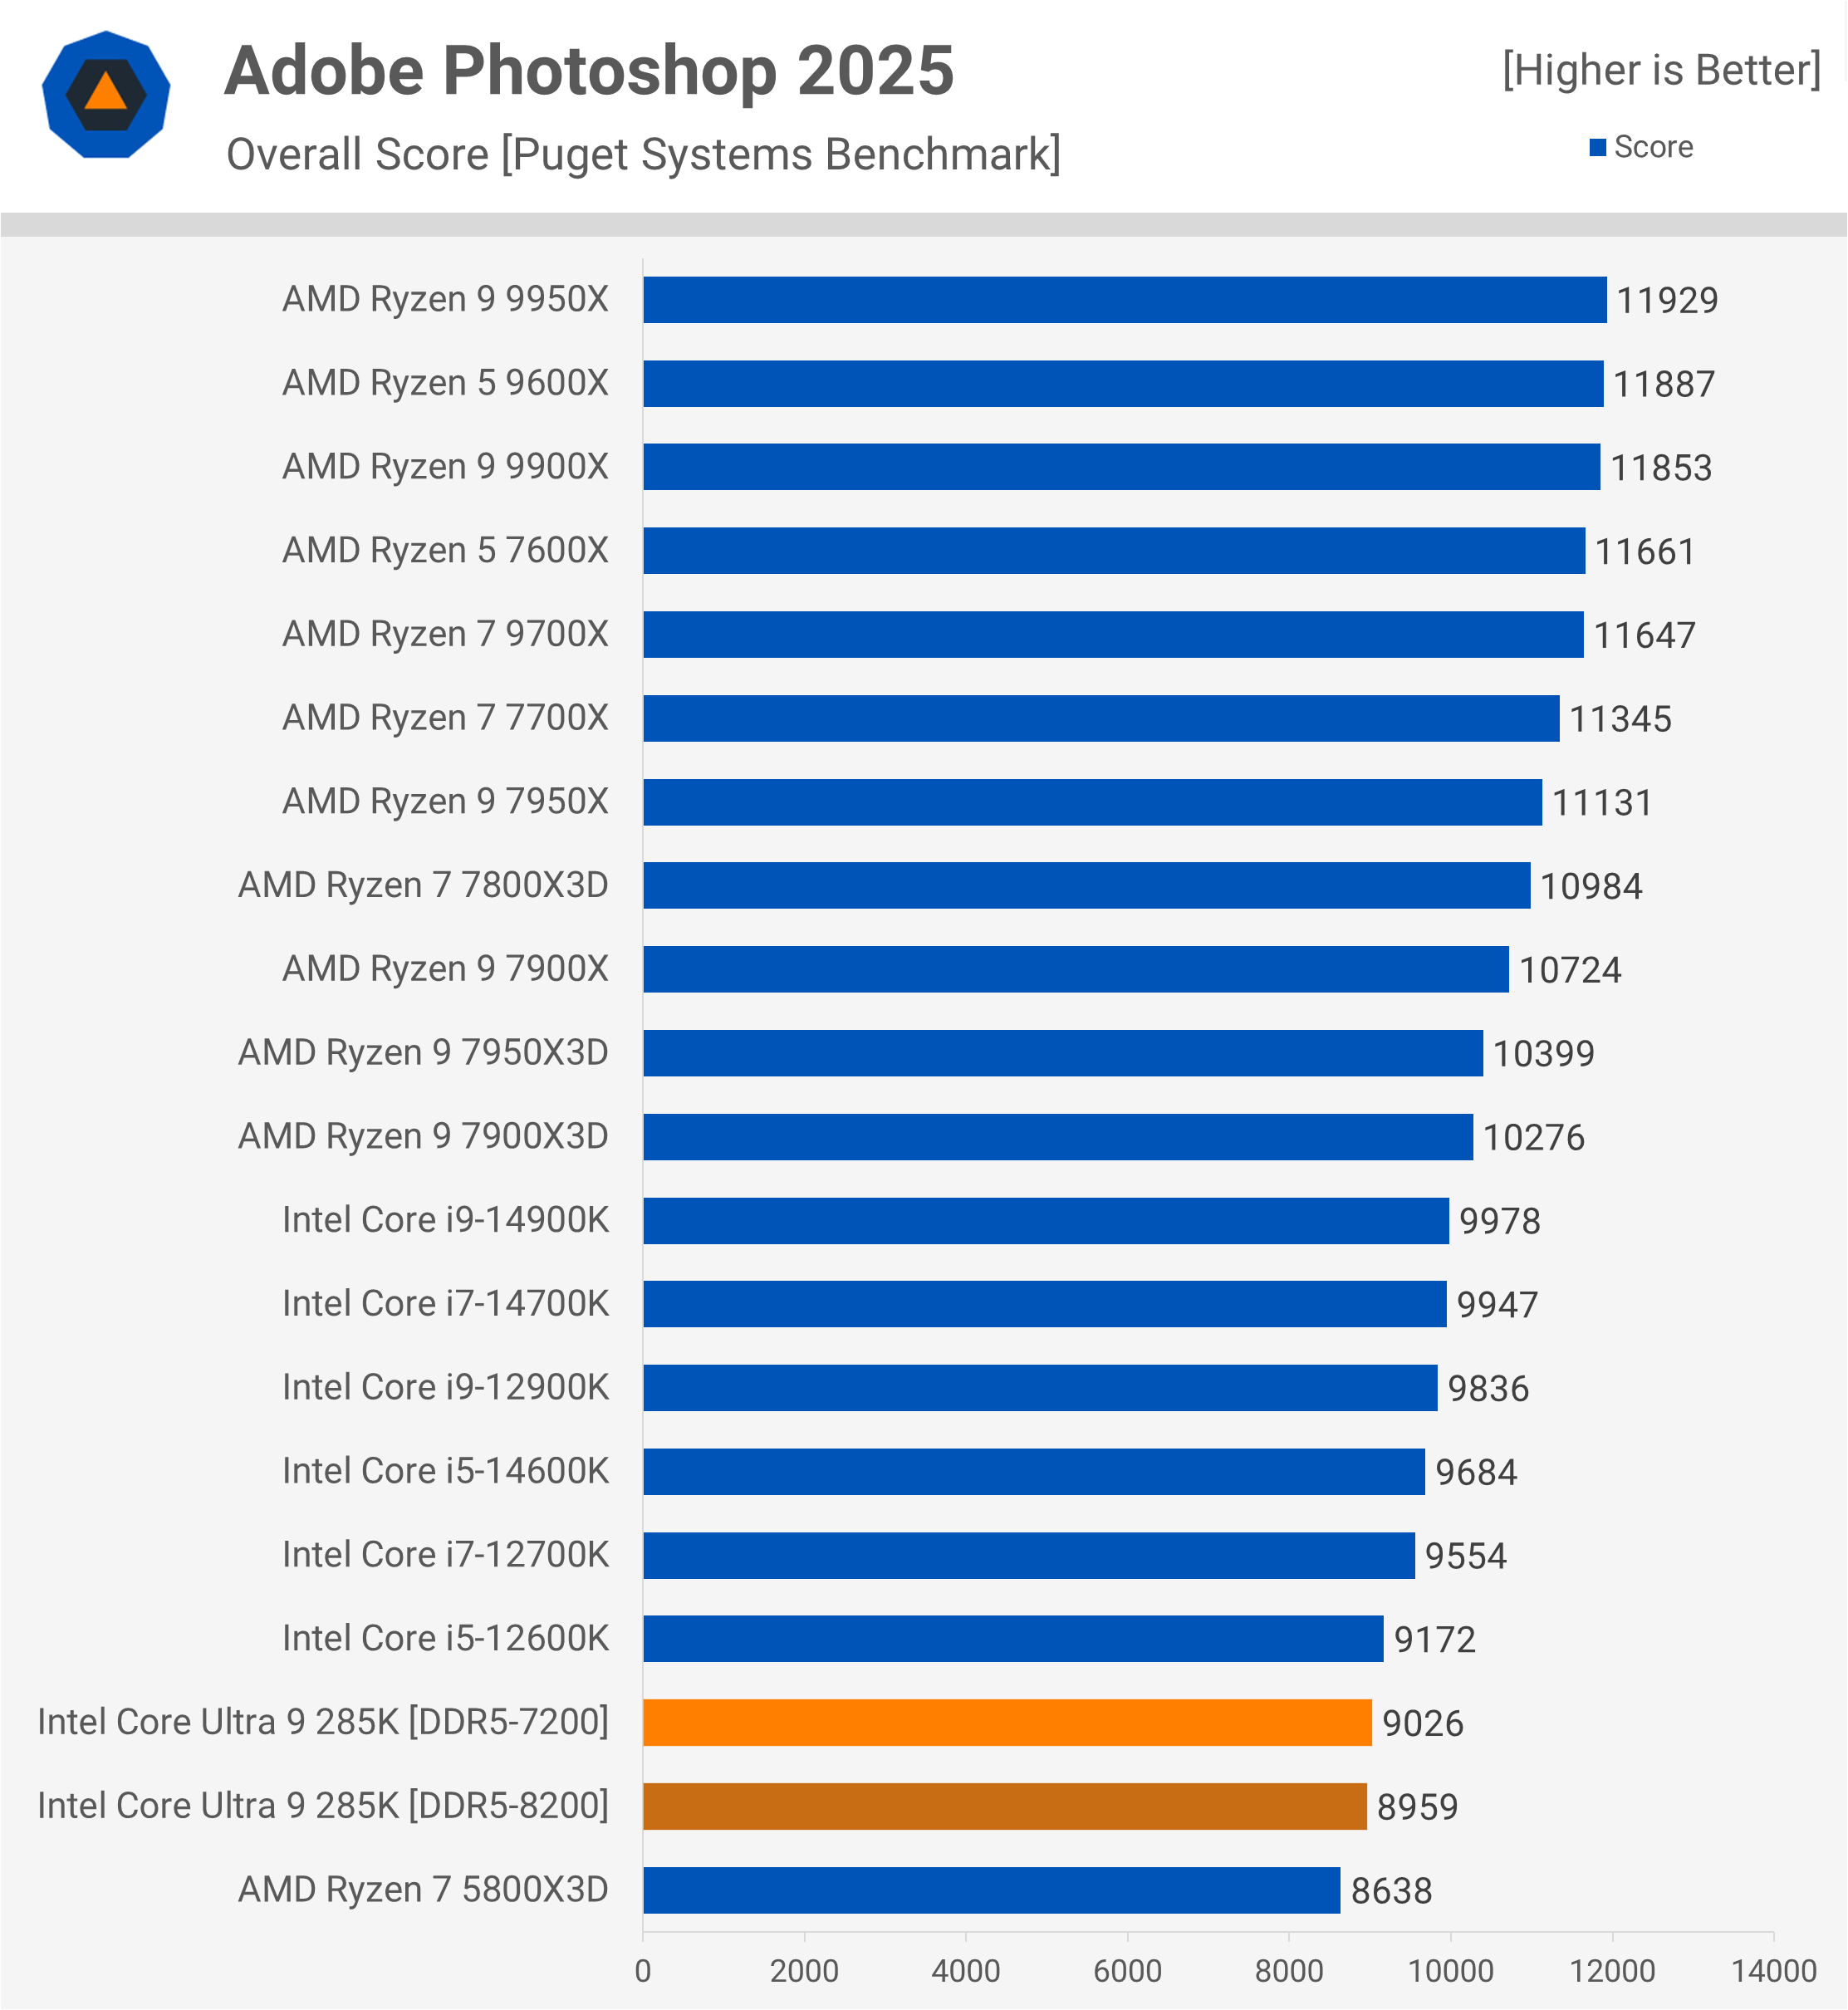
Despite the impressive single-core scores seen in Cinebench, the 285K’s performance in the lightly threaded Photoshop benchmark is disappointing. It’s slightly slower than the Core i5-12600K, making it one of the slowest CPUs we’ve tested in this benchmark, which is both puzzling and disappointing.
Adobe Premiere Pro 2024
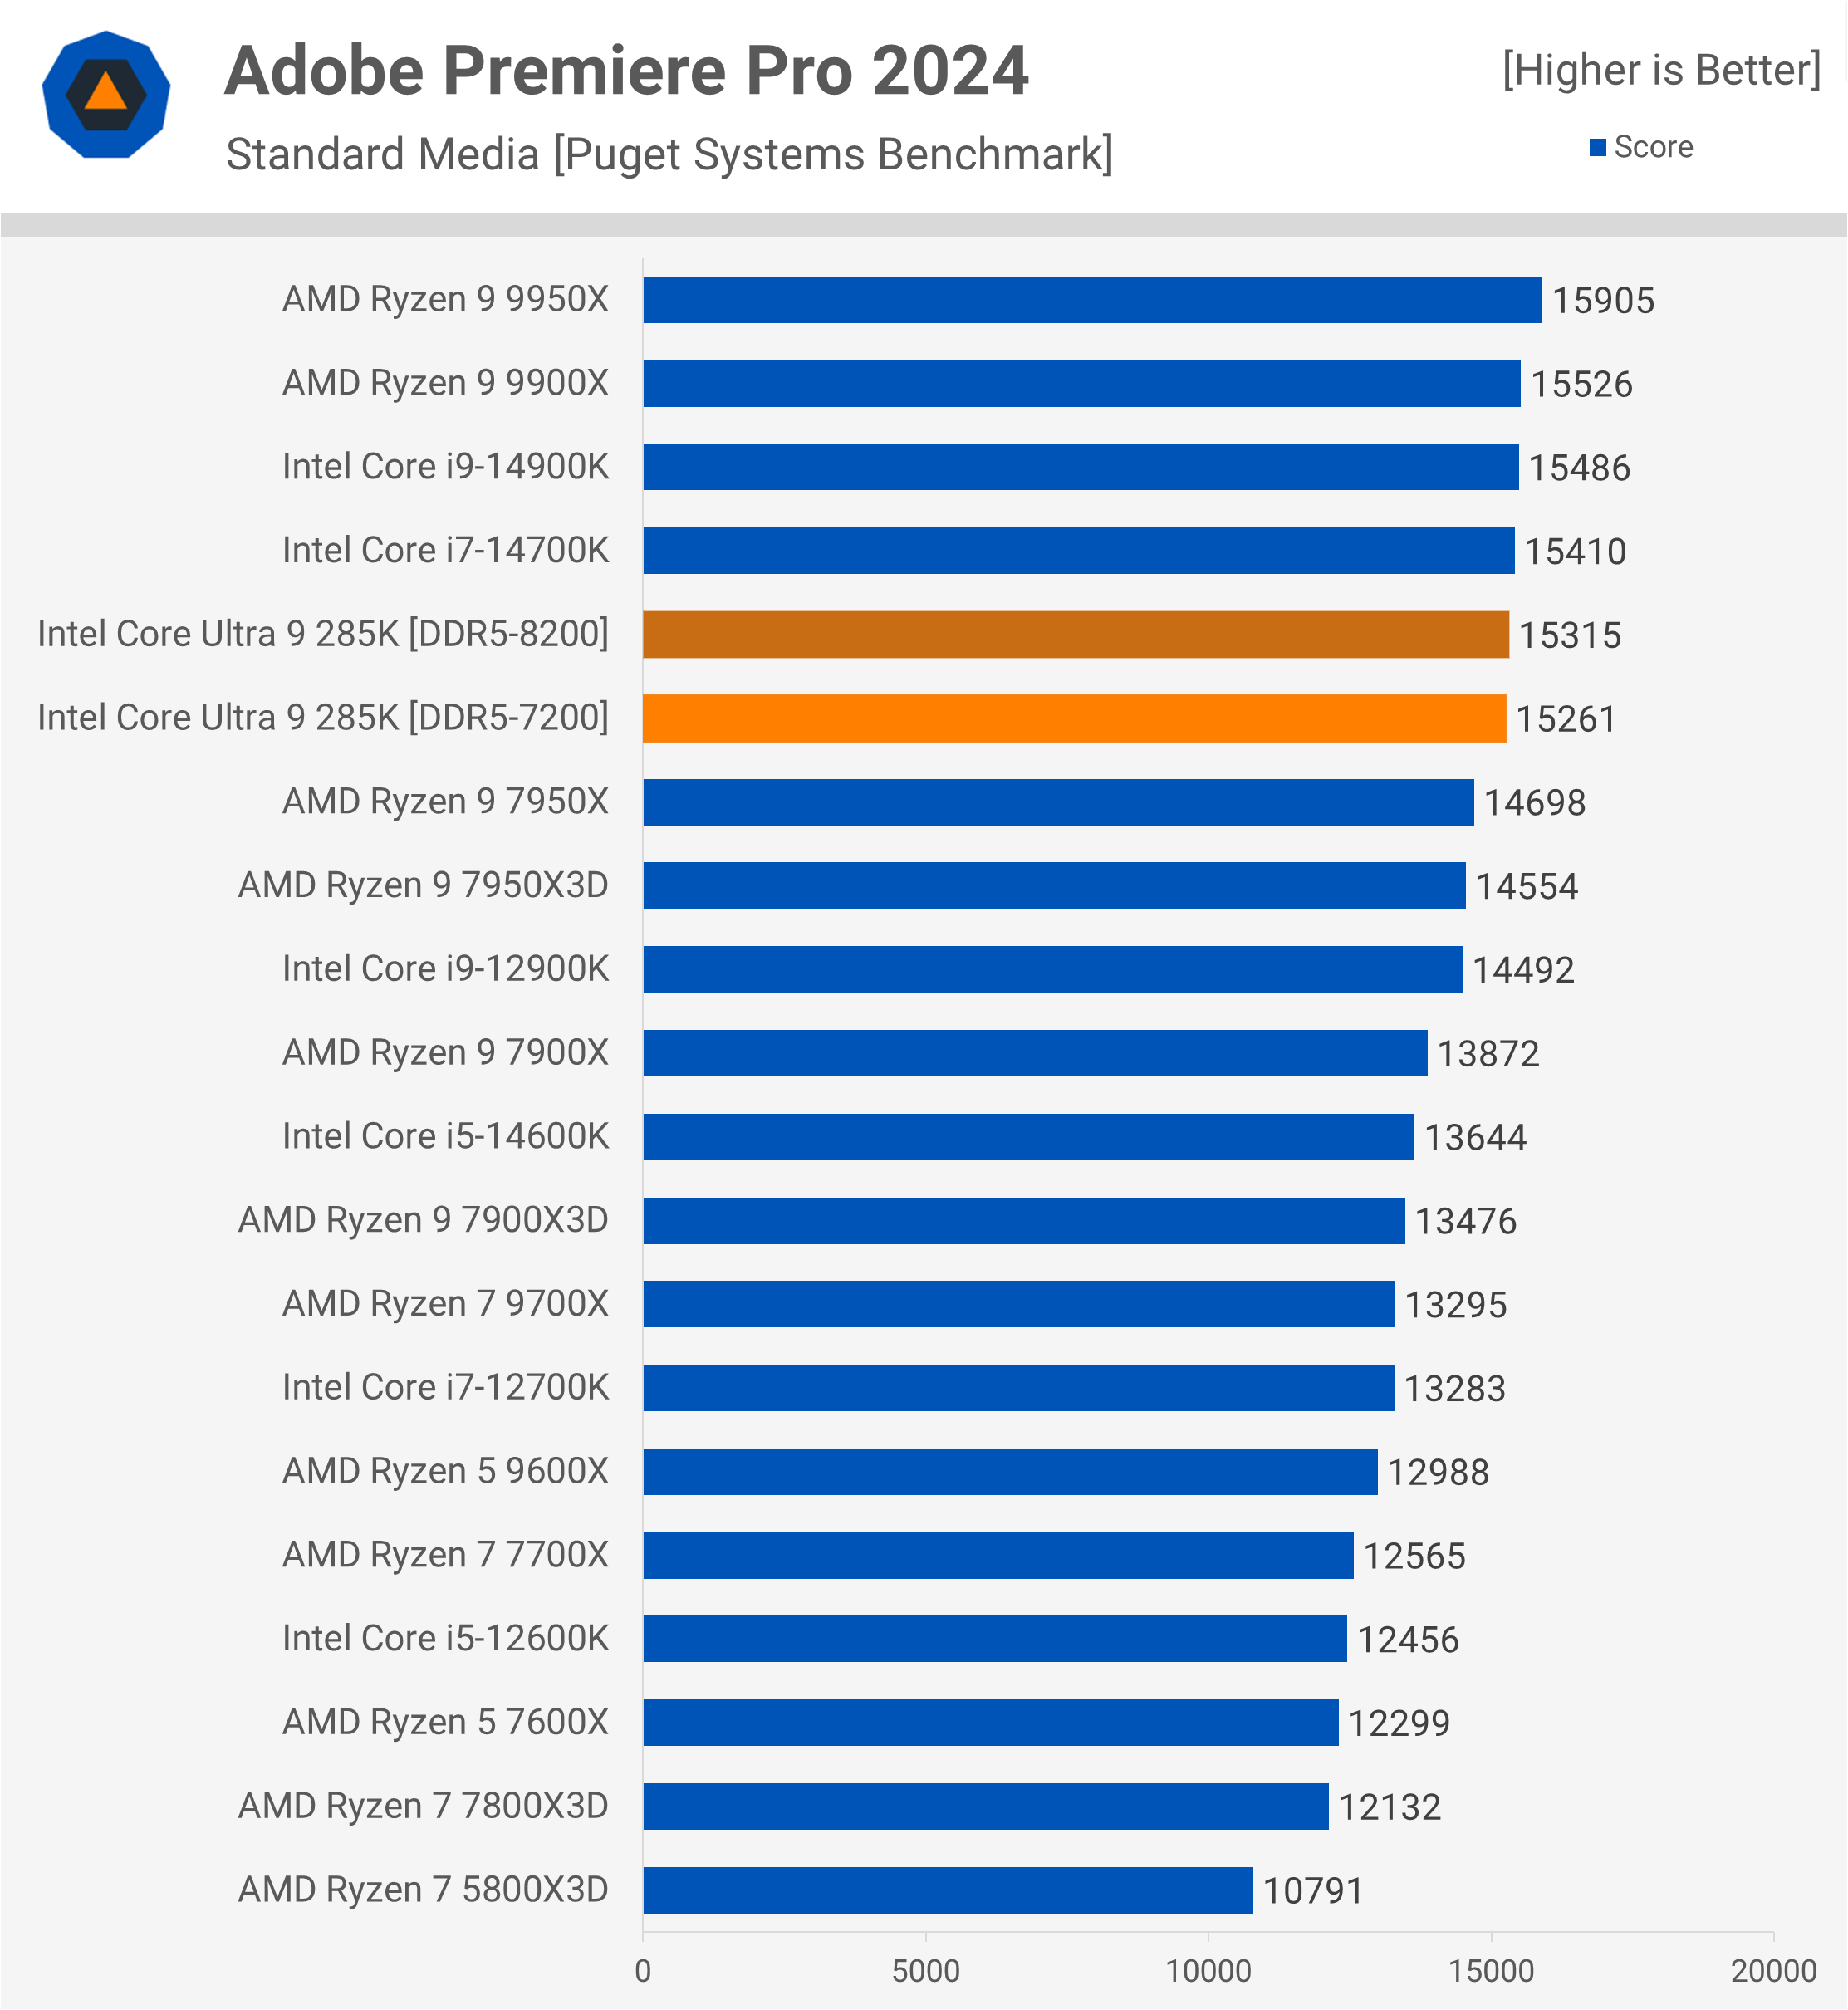
Fortunately, performance in Adobe Premiere Pro is much better, though still slightly behind the 14900K. This result, while better, is still underwhelming for a next-generation product.
Gaming Benchmarks
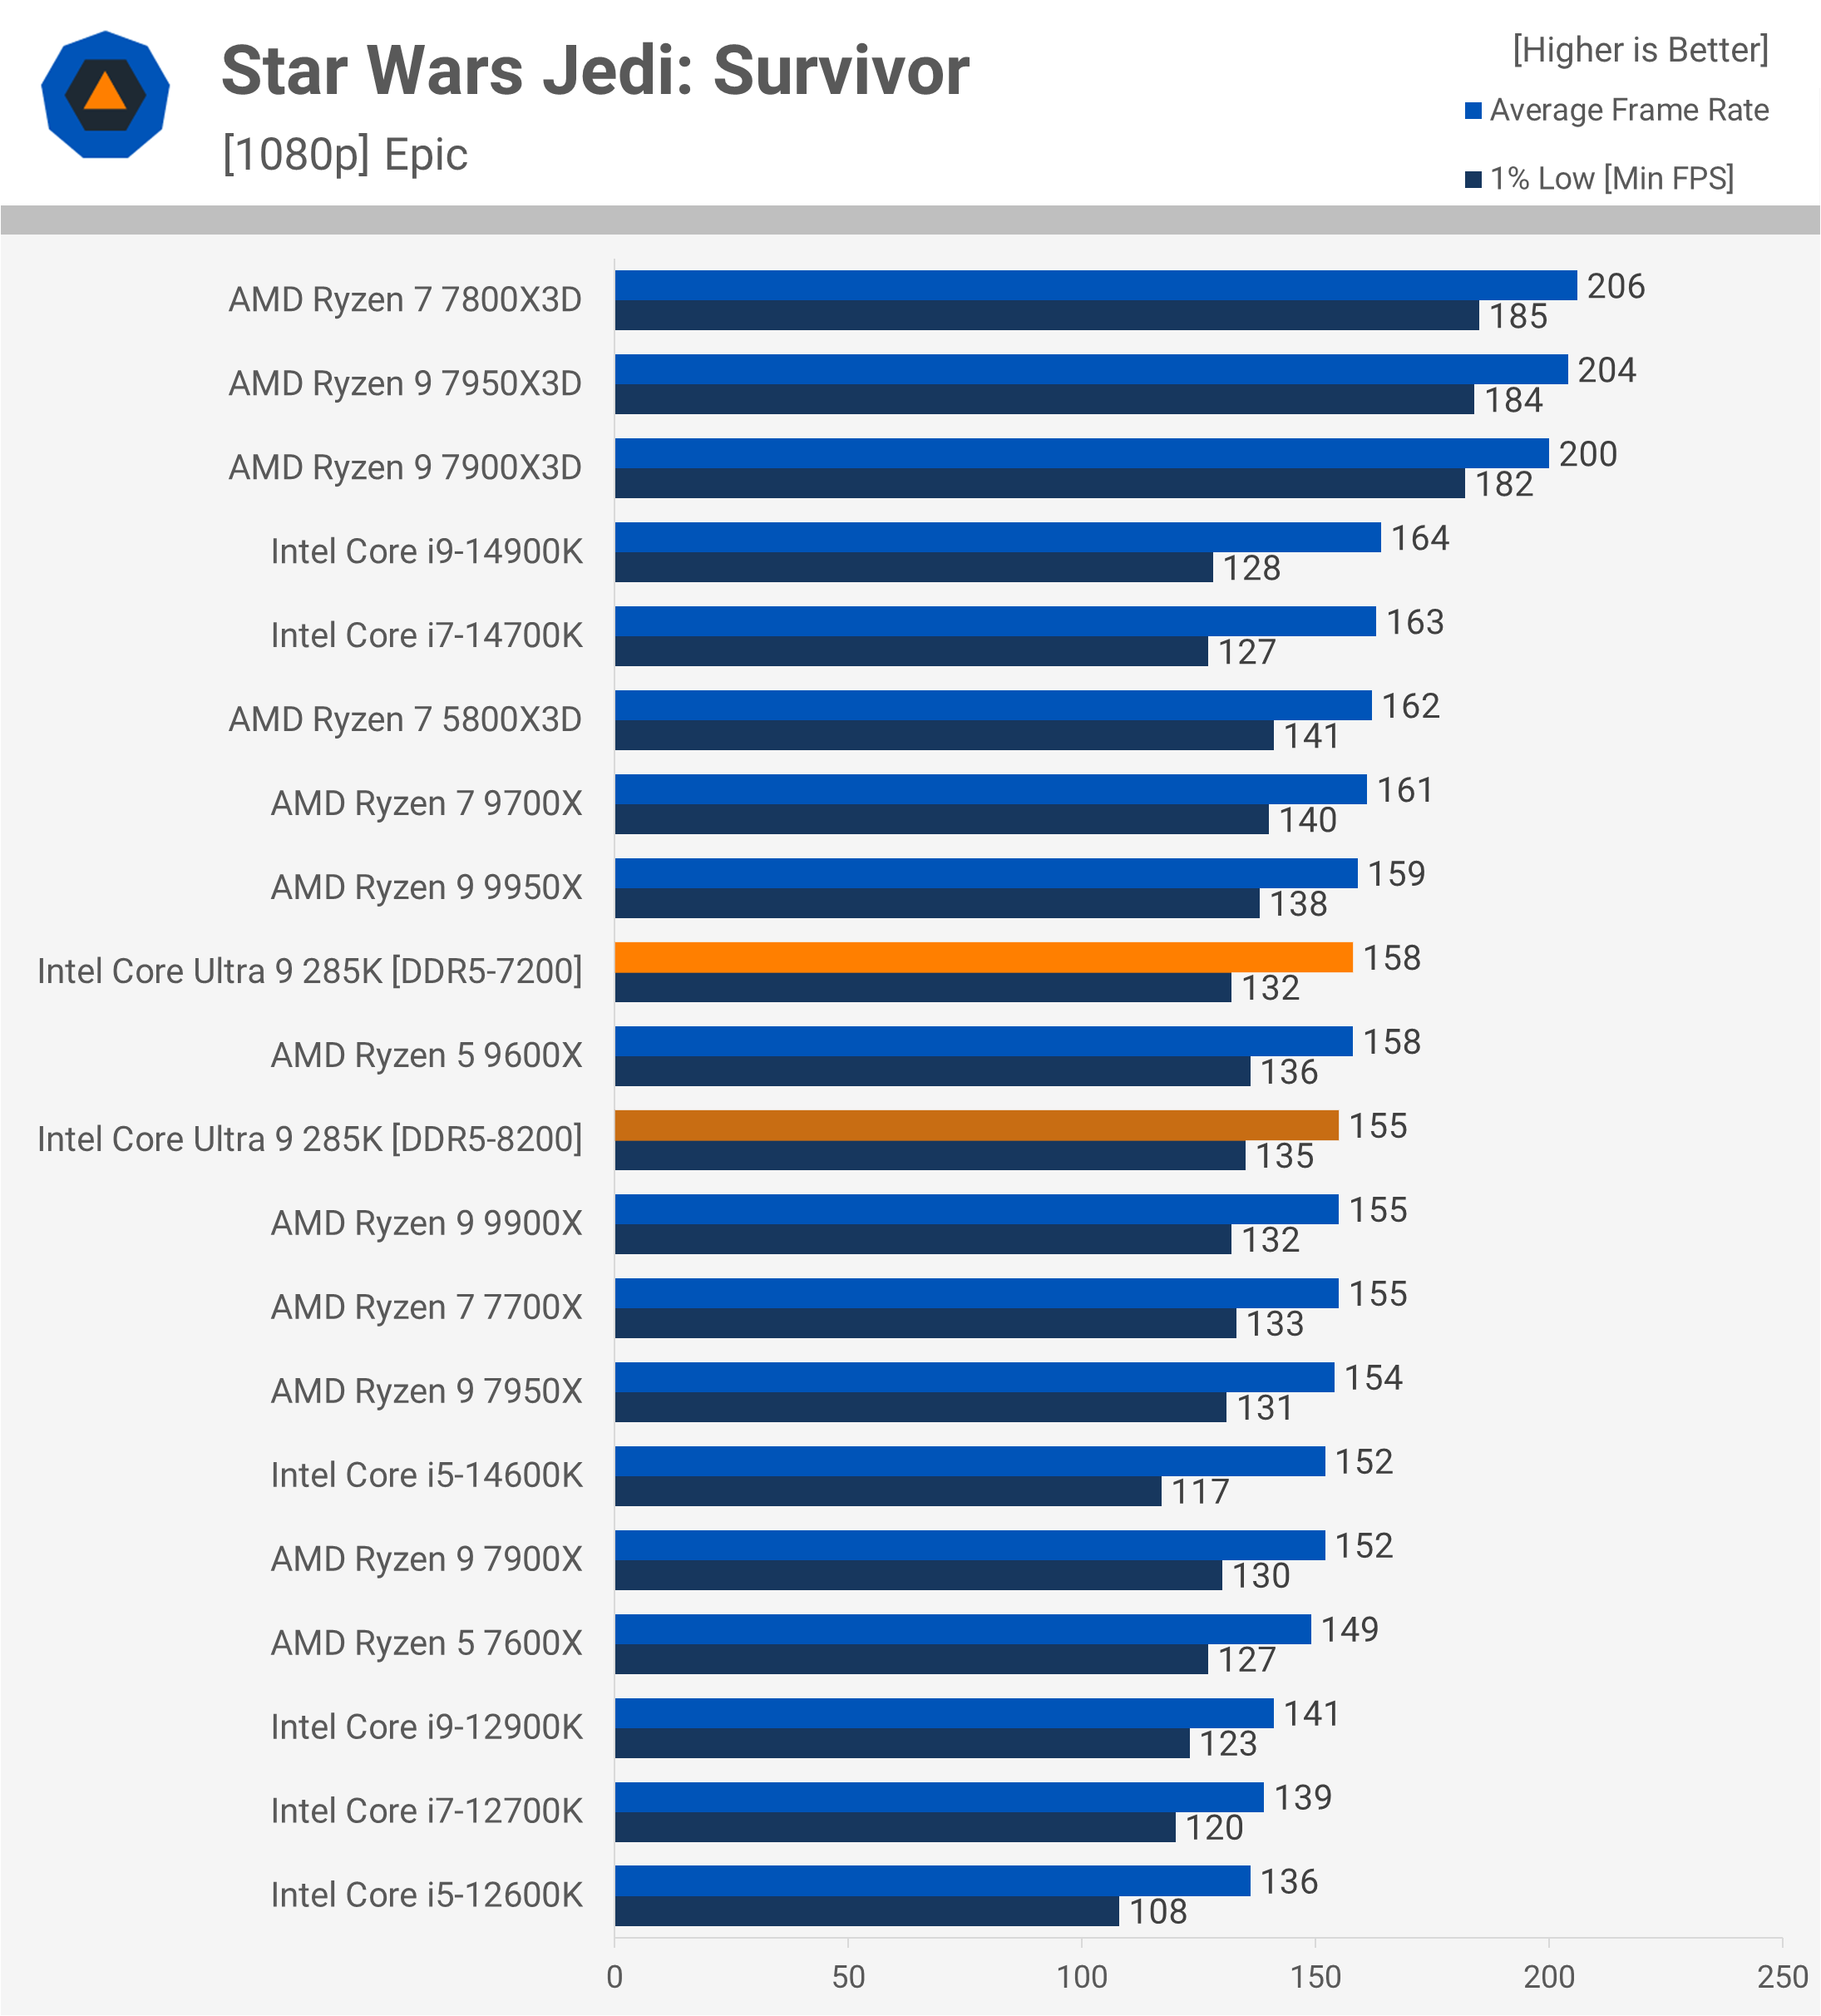
Let’s dive into the gaming benchmarks, starting with Star Wars Jedi: Survivor. Ryzen processors received a notable performance boost in this title with Windows 11 24H2. While the gains for 14th-gen Intel processors were smaller, they were still present. Unfortunately, parts like the 285K are currently around 5-10% slower on 24H2, so the 285K data presented here was gathered using 23H2.
Star Wars Jedi: Survivor
Ignoring the X3D CPUs, which are blazing fast in this test, the Intel 285K delivered fairly mid-range performance, coming in 4% slower than the 14900K. Additionally, the lower-latency DDR5-7200 memory was slightly faster than the 8200 memory in this case.
The Last of Us Part 1
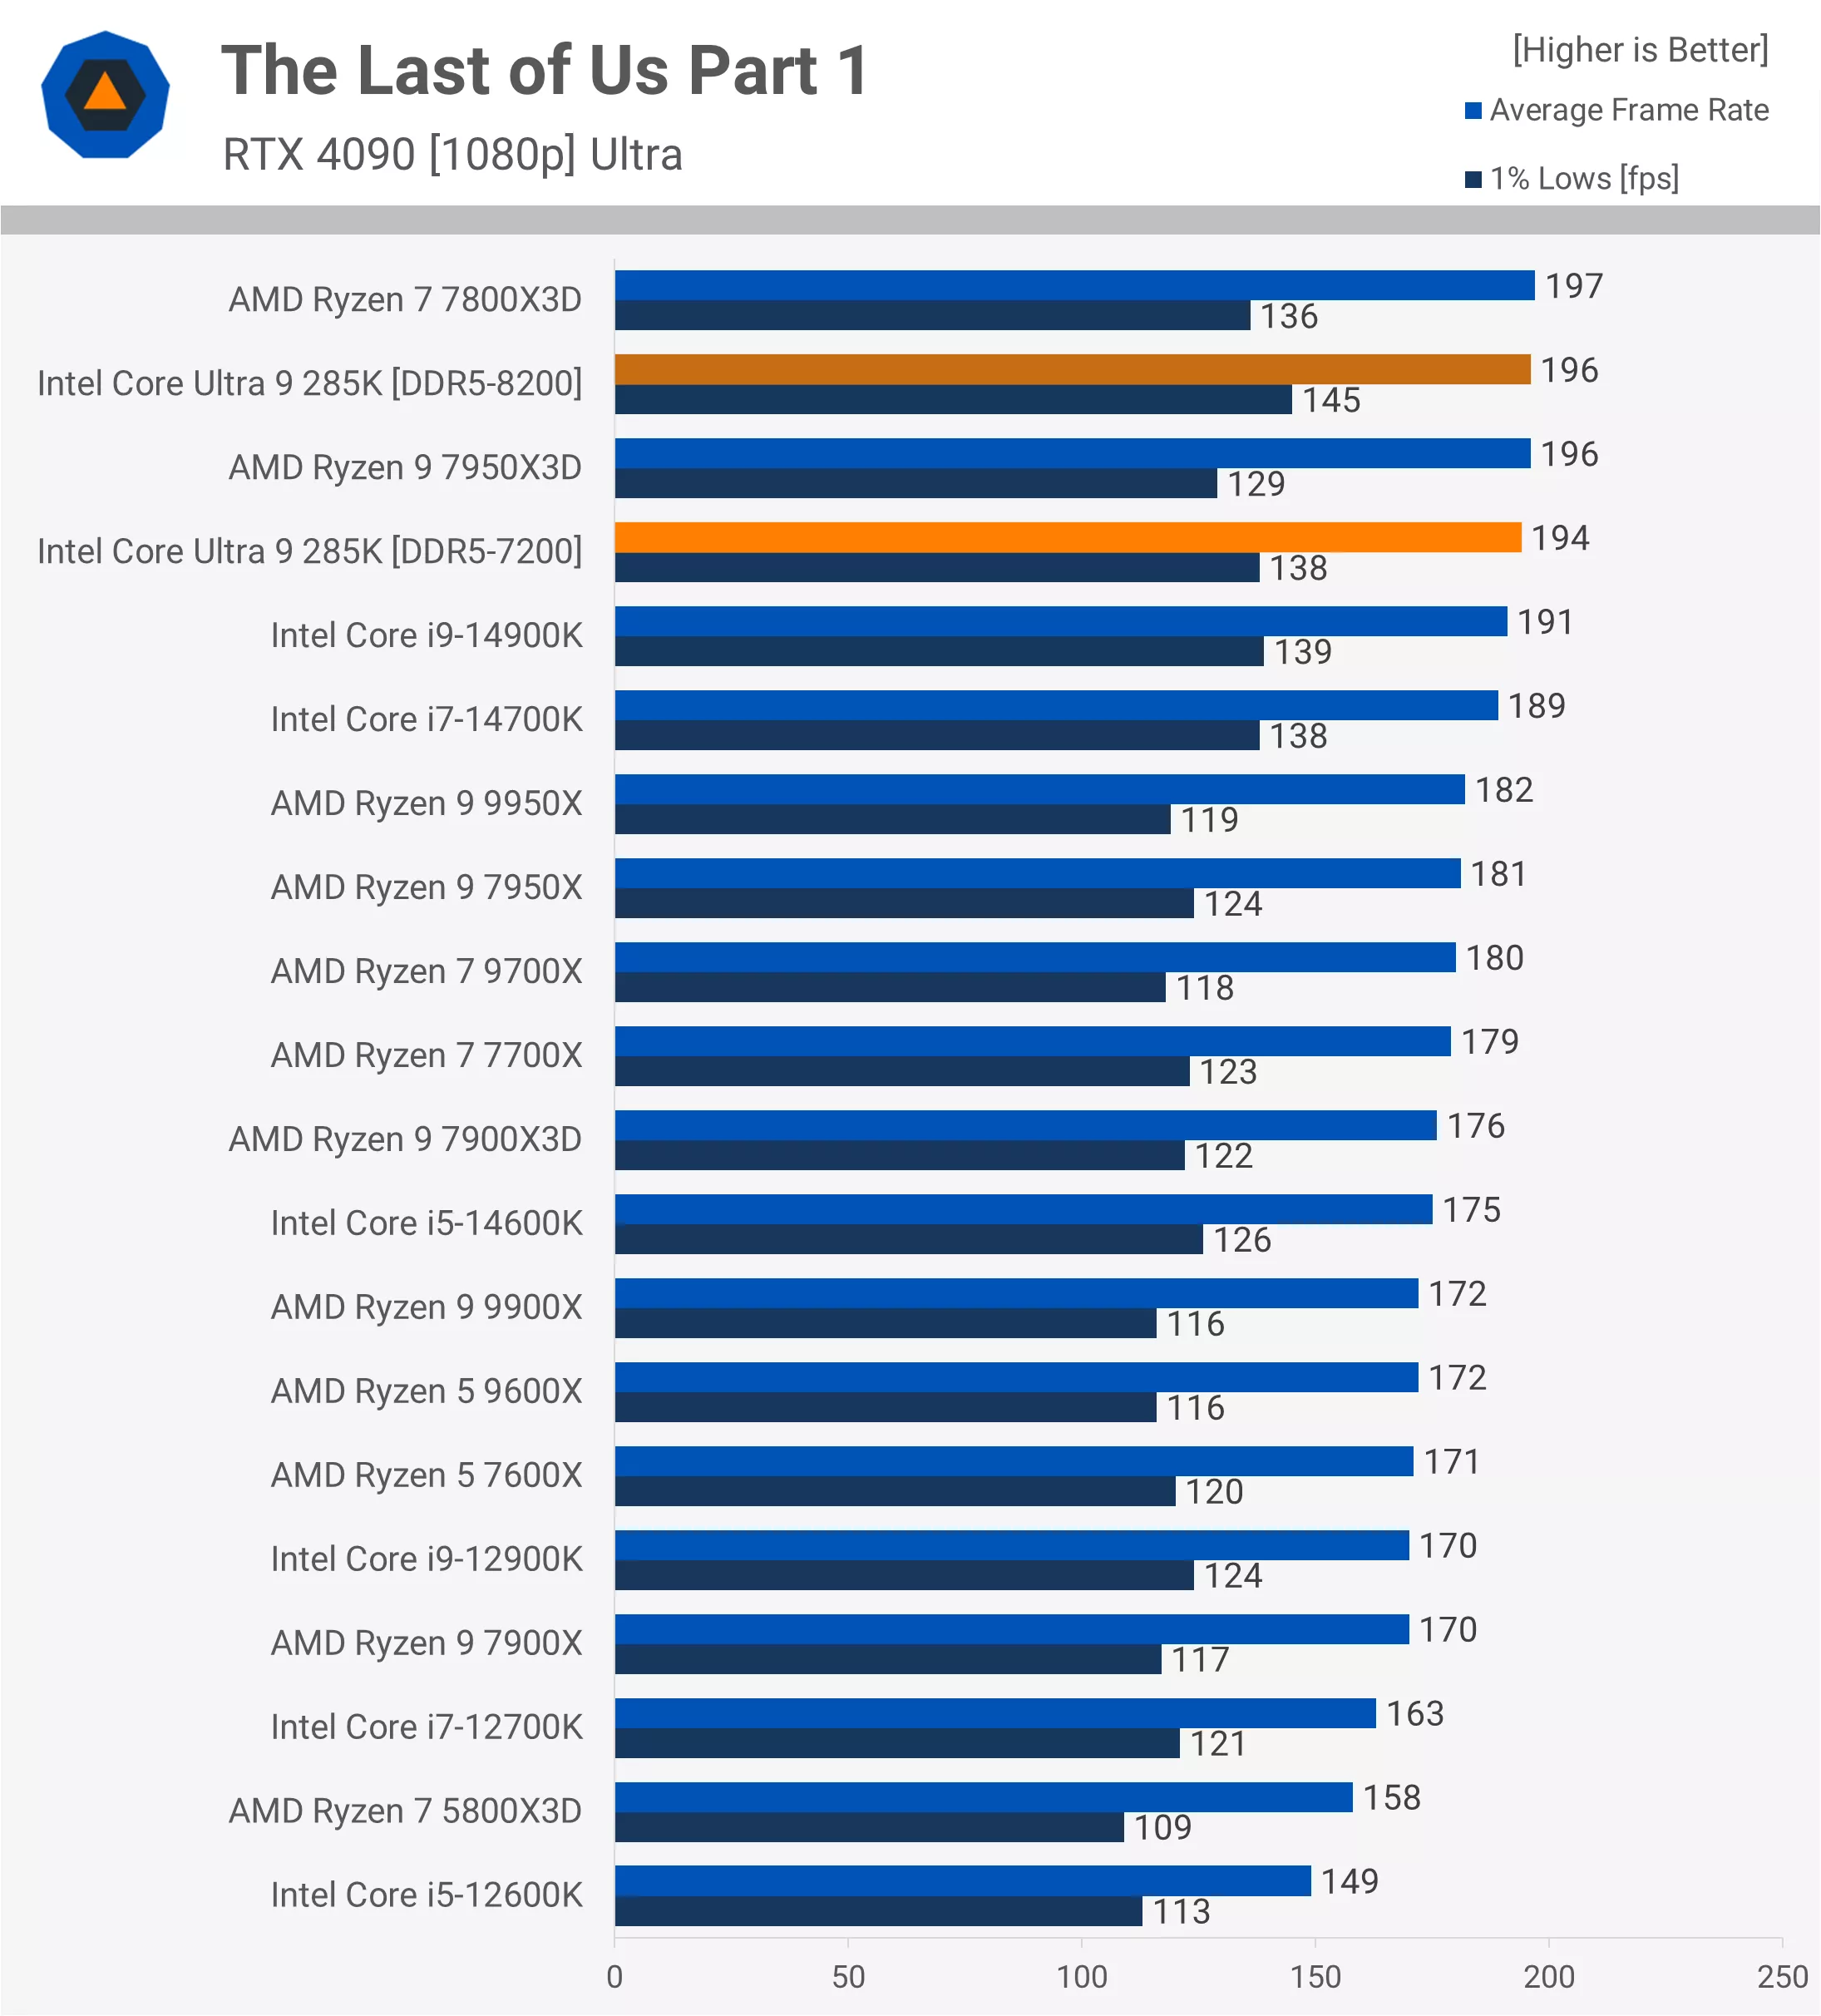
The 285K performed impressively in The Last of Us Part 1, delivering performance comparable to the 7800X3D and slightly faster than the 14900K. However, with the same 7200 memory, we only observed a 2% improvement, which is underwhelming for a next-gen product. Some might even call it a disappointment.
Cyberpunk 2077: Phantom Liberty
This is where things really go off the rails. You might see reviews where the 285K performs similarly to the 14900K in Cyberpunk 2077: Phantom Liberty, but those reviews likely used the built-in benchmark or tested sections of the game that aren’t very CPU-intensive. We have evidence for this, which we will explain later.
In more CPU-demanding sections of the game, the 285K struggles significantly. We’ve spent considerable time attempting to extract more performance in this test, with the best results coming from lower-latency memory, where tightening timings helped the most. However, despite testing motherboards from MSI, Gigabyte, Asrock, and Asus, and even performing multiple fresh Windows installs, the 285K remained at least 20% slower than the 14900K, making it the slowest CPU in this test.
Hogwarts Legacy
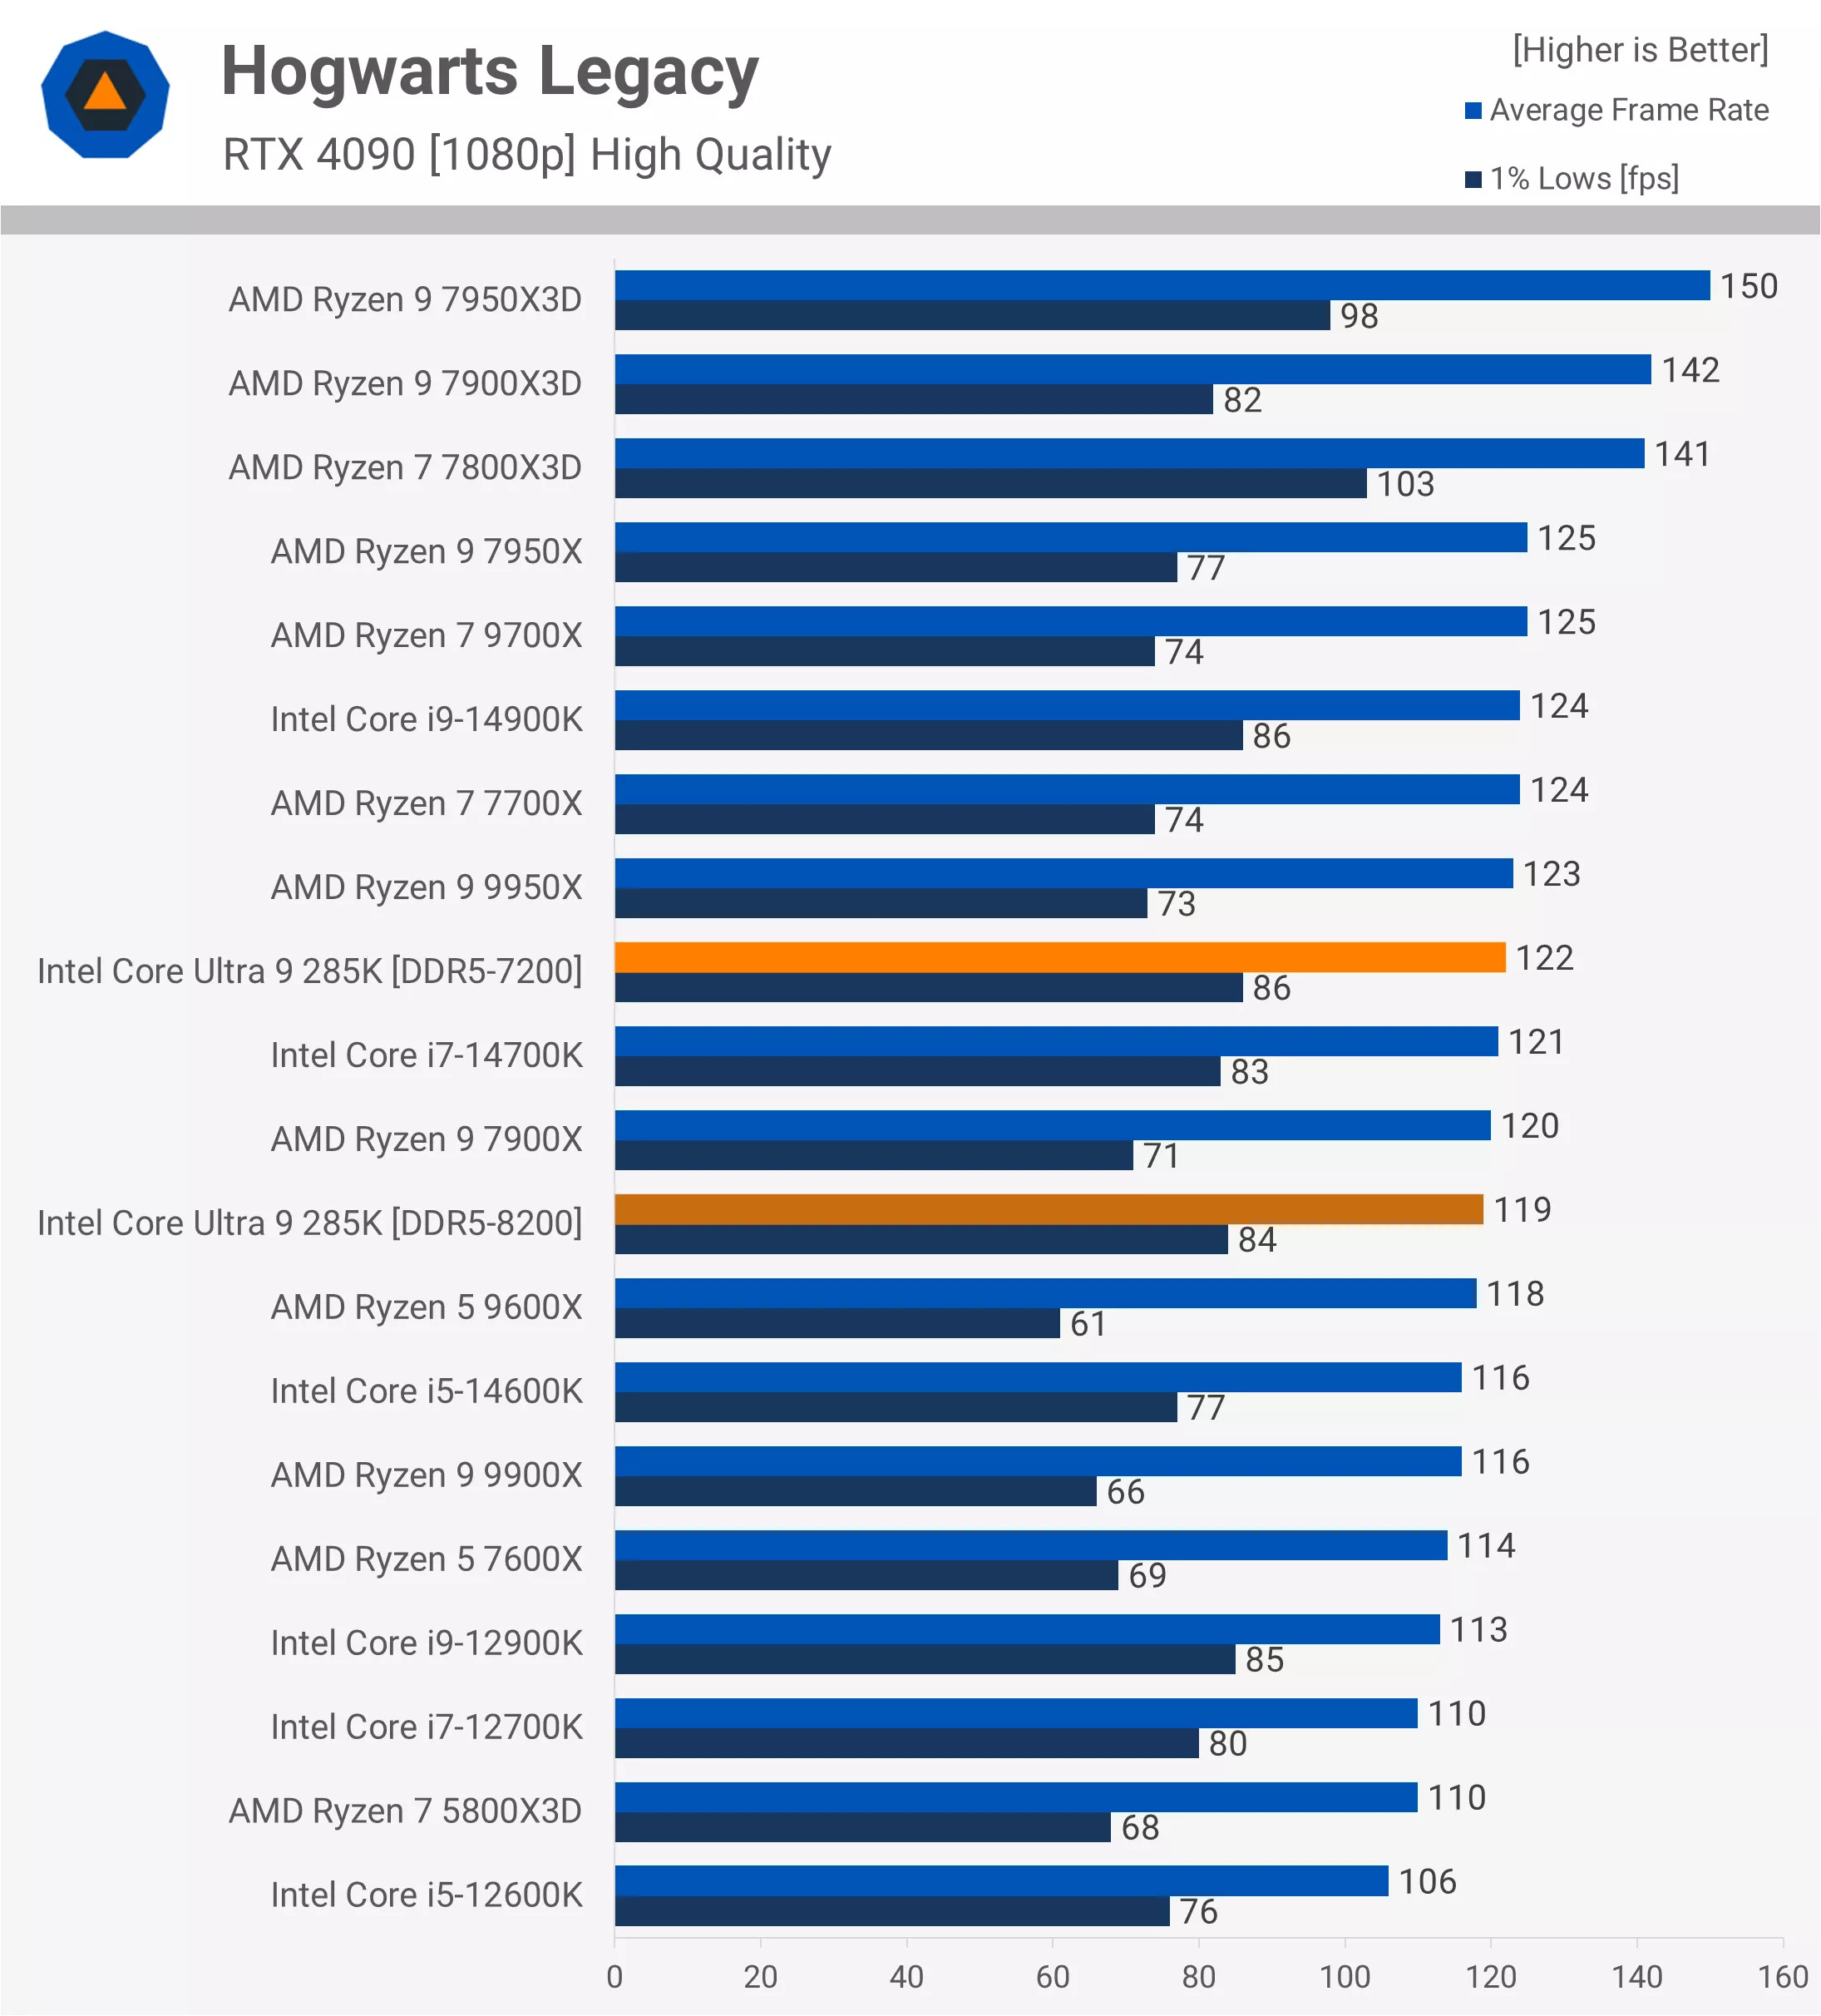
Performance in Hogwarts Legacy is better, but still poor overall. The 285K lagged behind the 14900K, making it slower than even the Ryzen 7 7700X. It’s surprising to see how much Windows 11 23H2 was holding back Zen 4 and Zen 5 processors, as we now regularly find the 7700X matching the 14900K’s performance. Additionally, the Intel CPU is no longer running without power limits.
Assetto Corsa Competizione
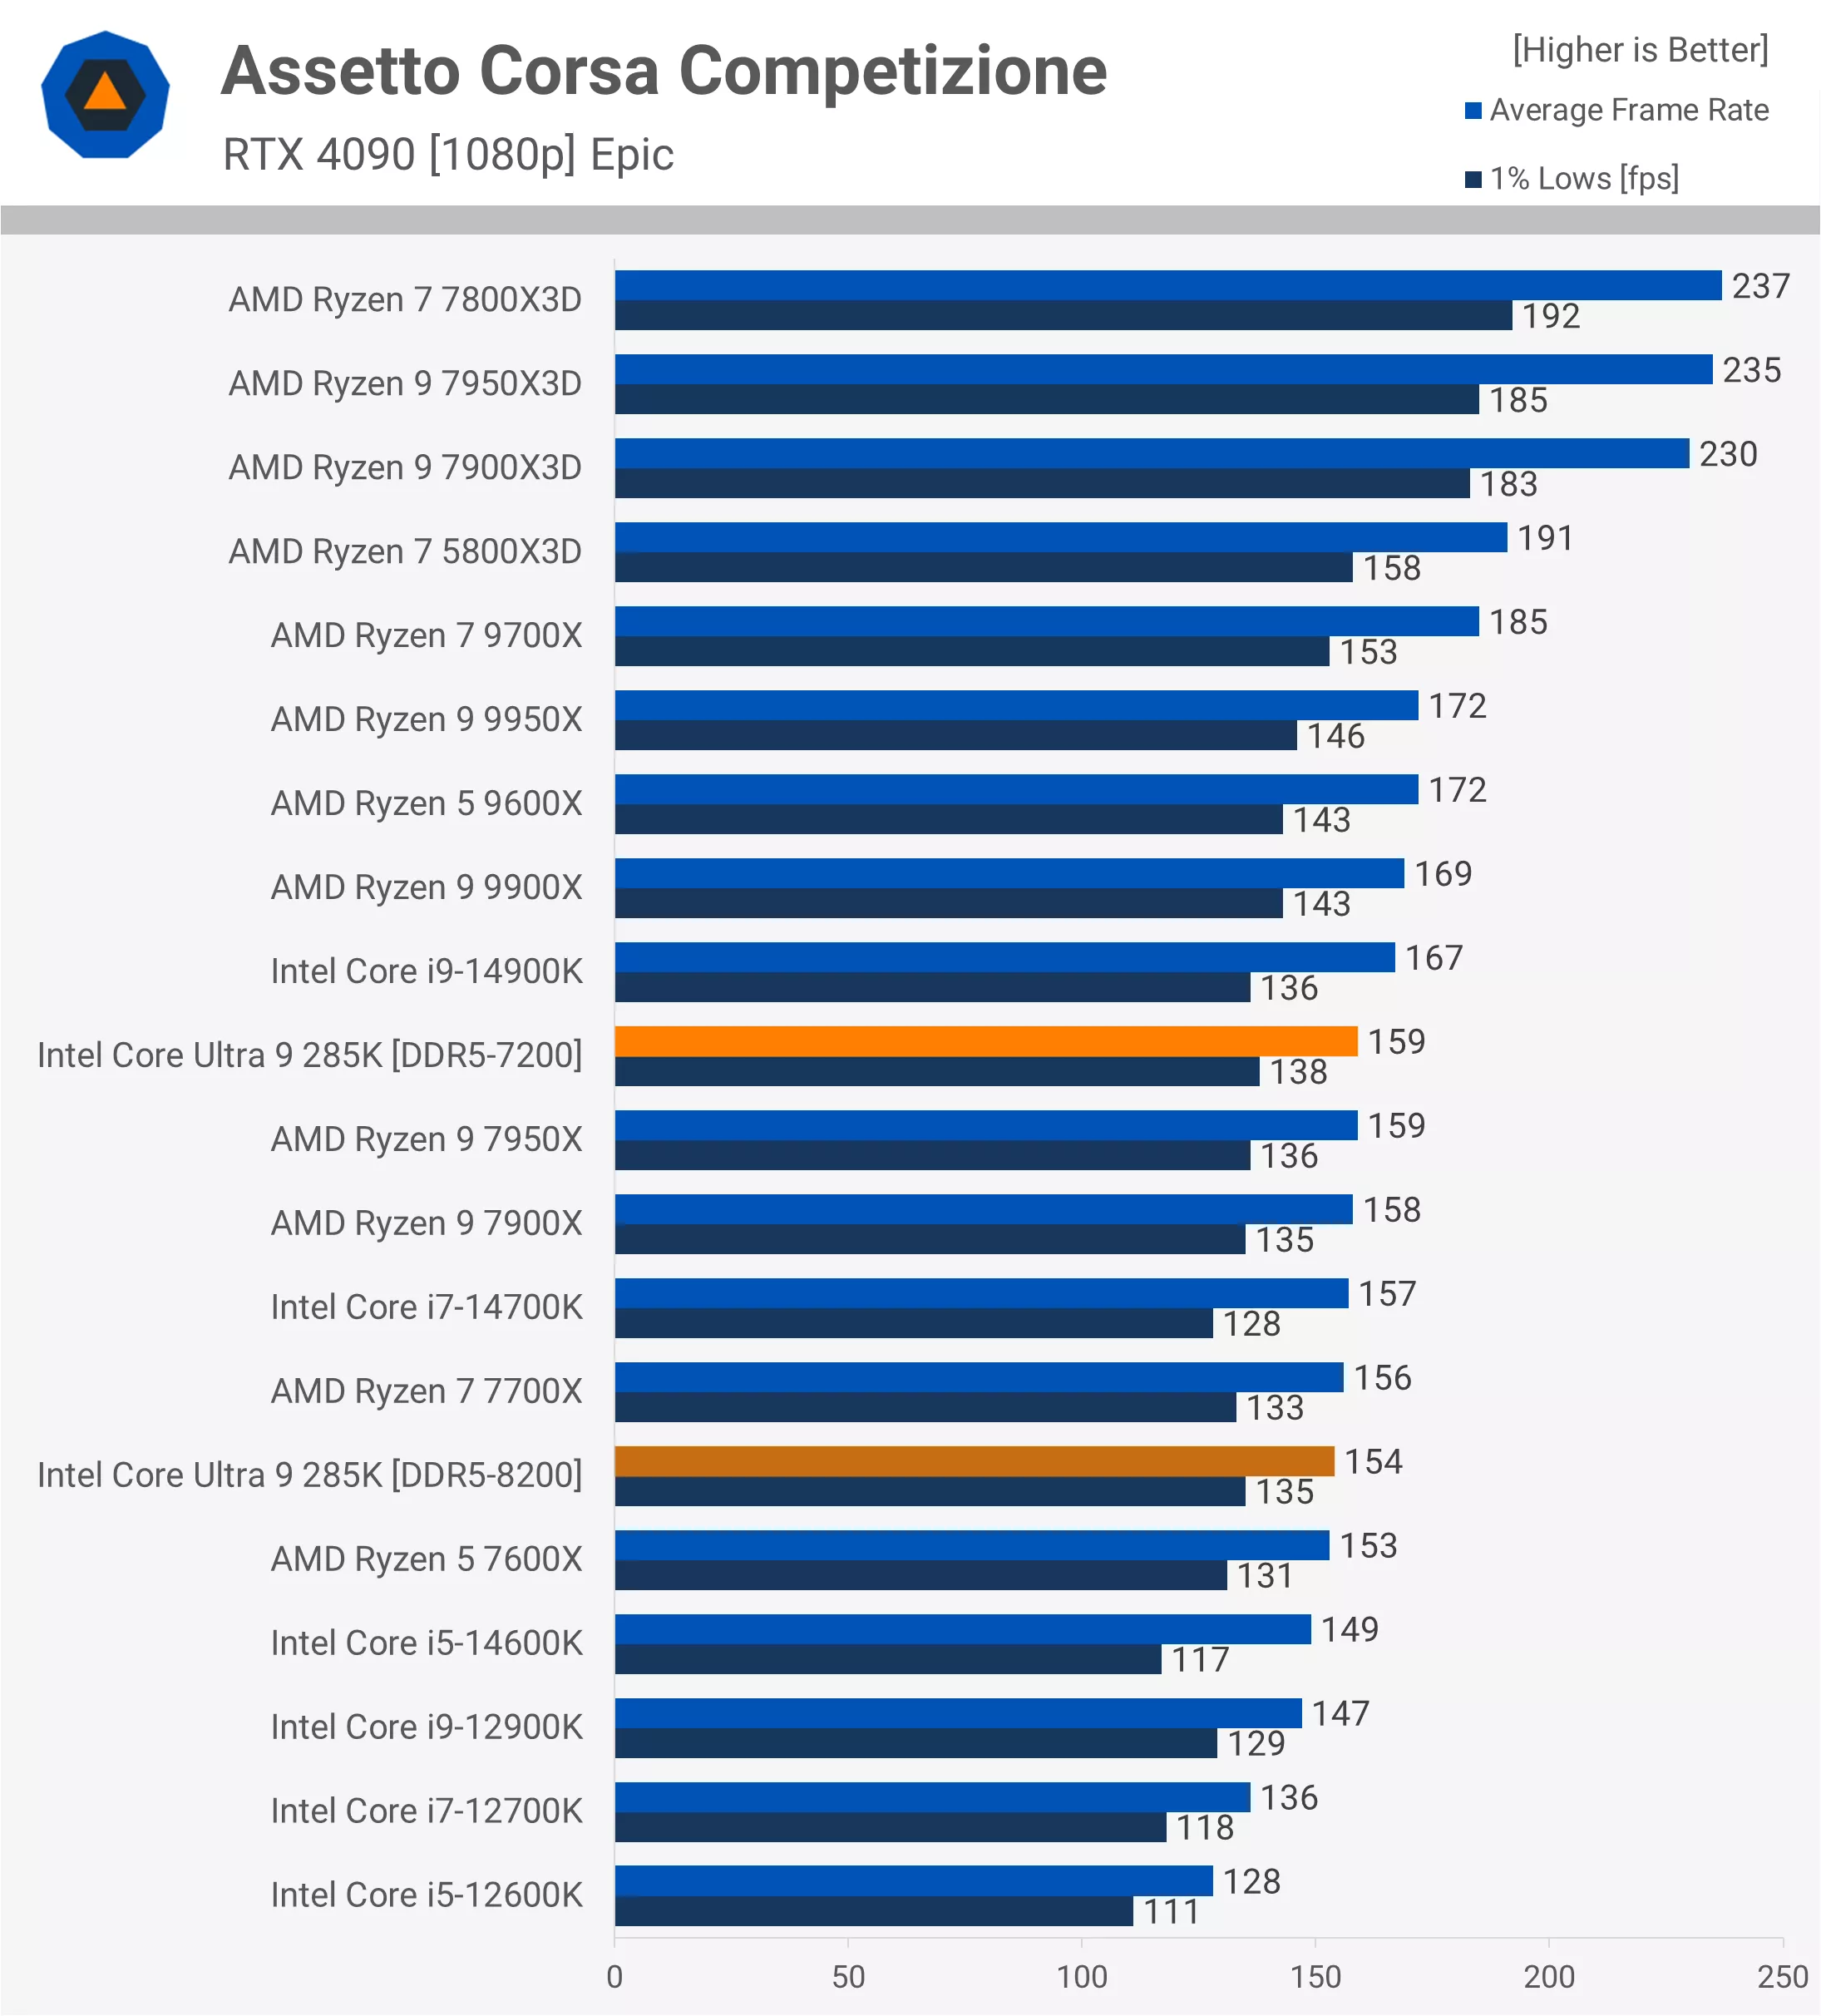
In ACC, the 285K fell behind the 14900K by 5%, making it 14% slower than the 9700X and 32% slower than the 7950X3D, meaning Arrow Lake is not an ideal choice for this driving simulator.
Remnant II
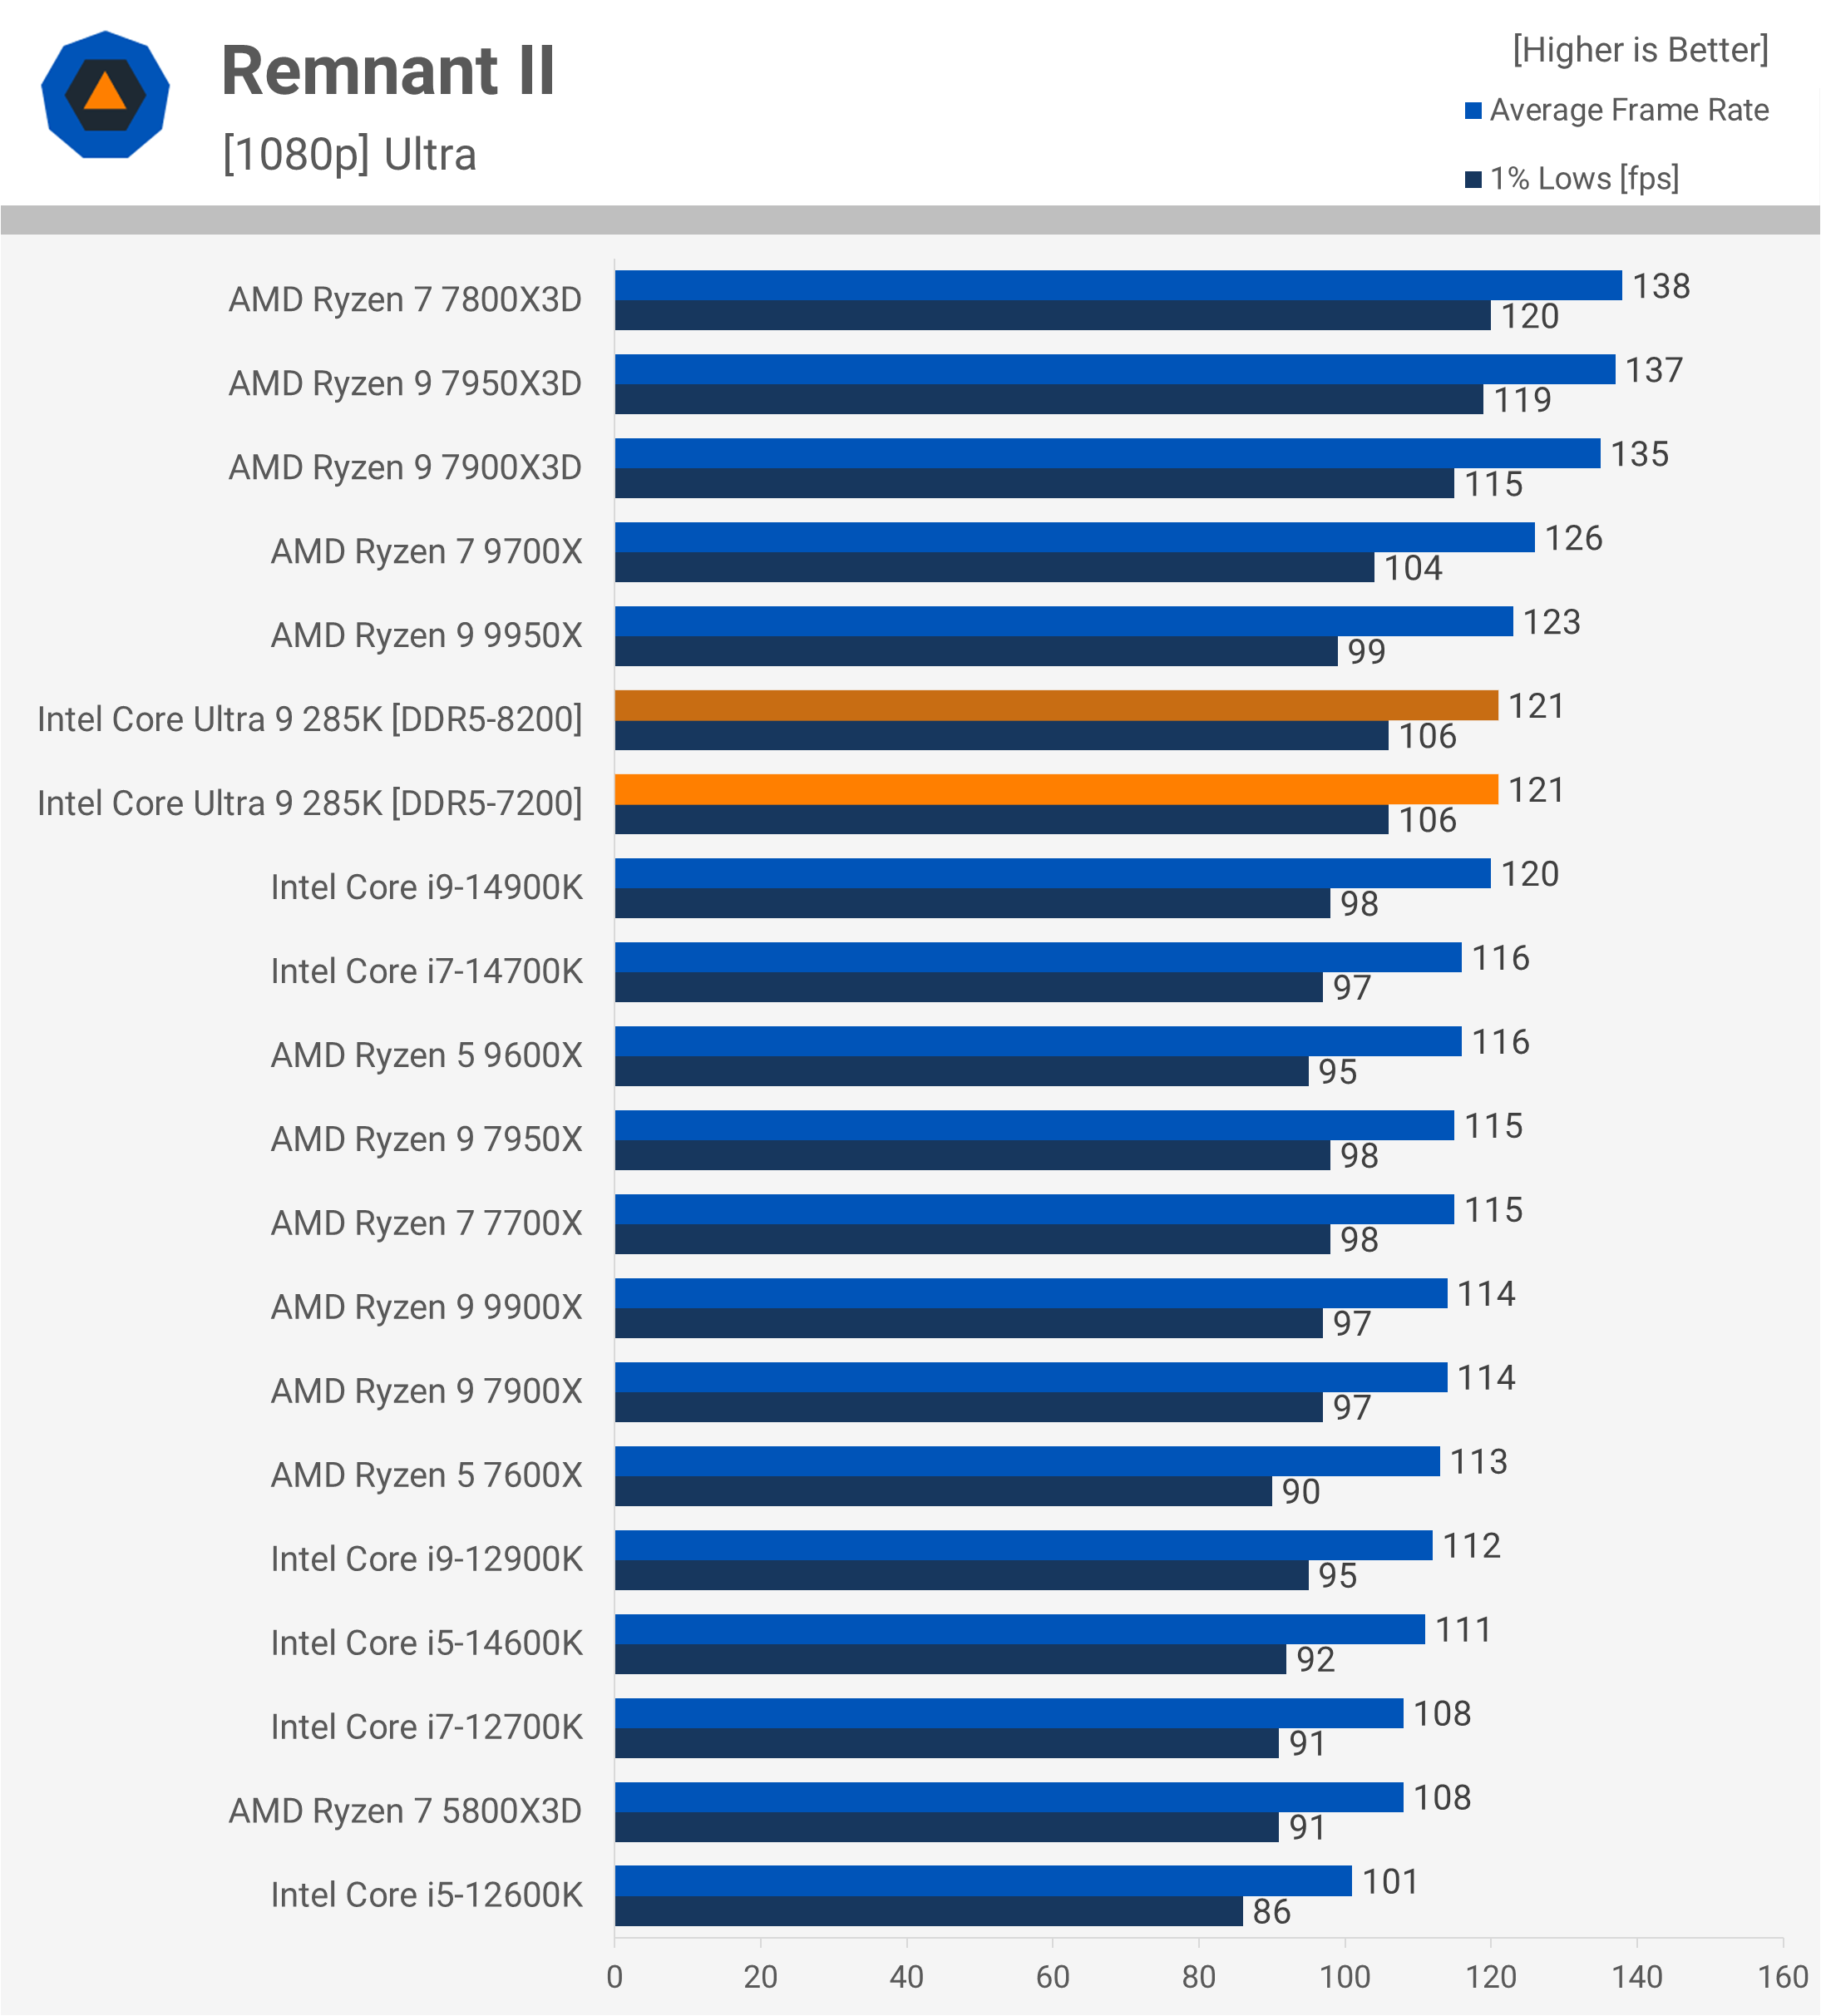
Remnant II produced data closer to what Intel had promised, with the 1% lows being significantly better on the 285K compared to the 14900K. However, despite matching Intel’s previous flagship, the 285K still trailed behind the Zen 4 X3D parts.
Homeworld 3
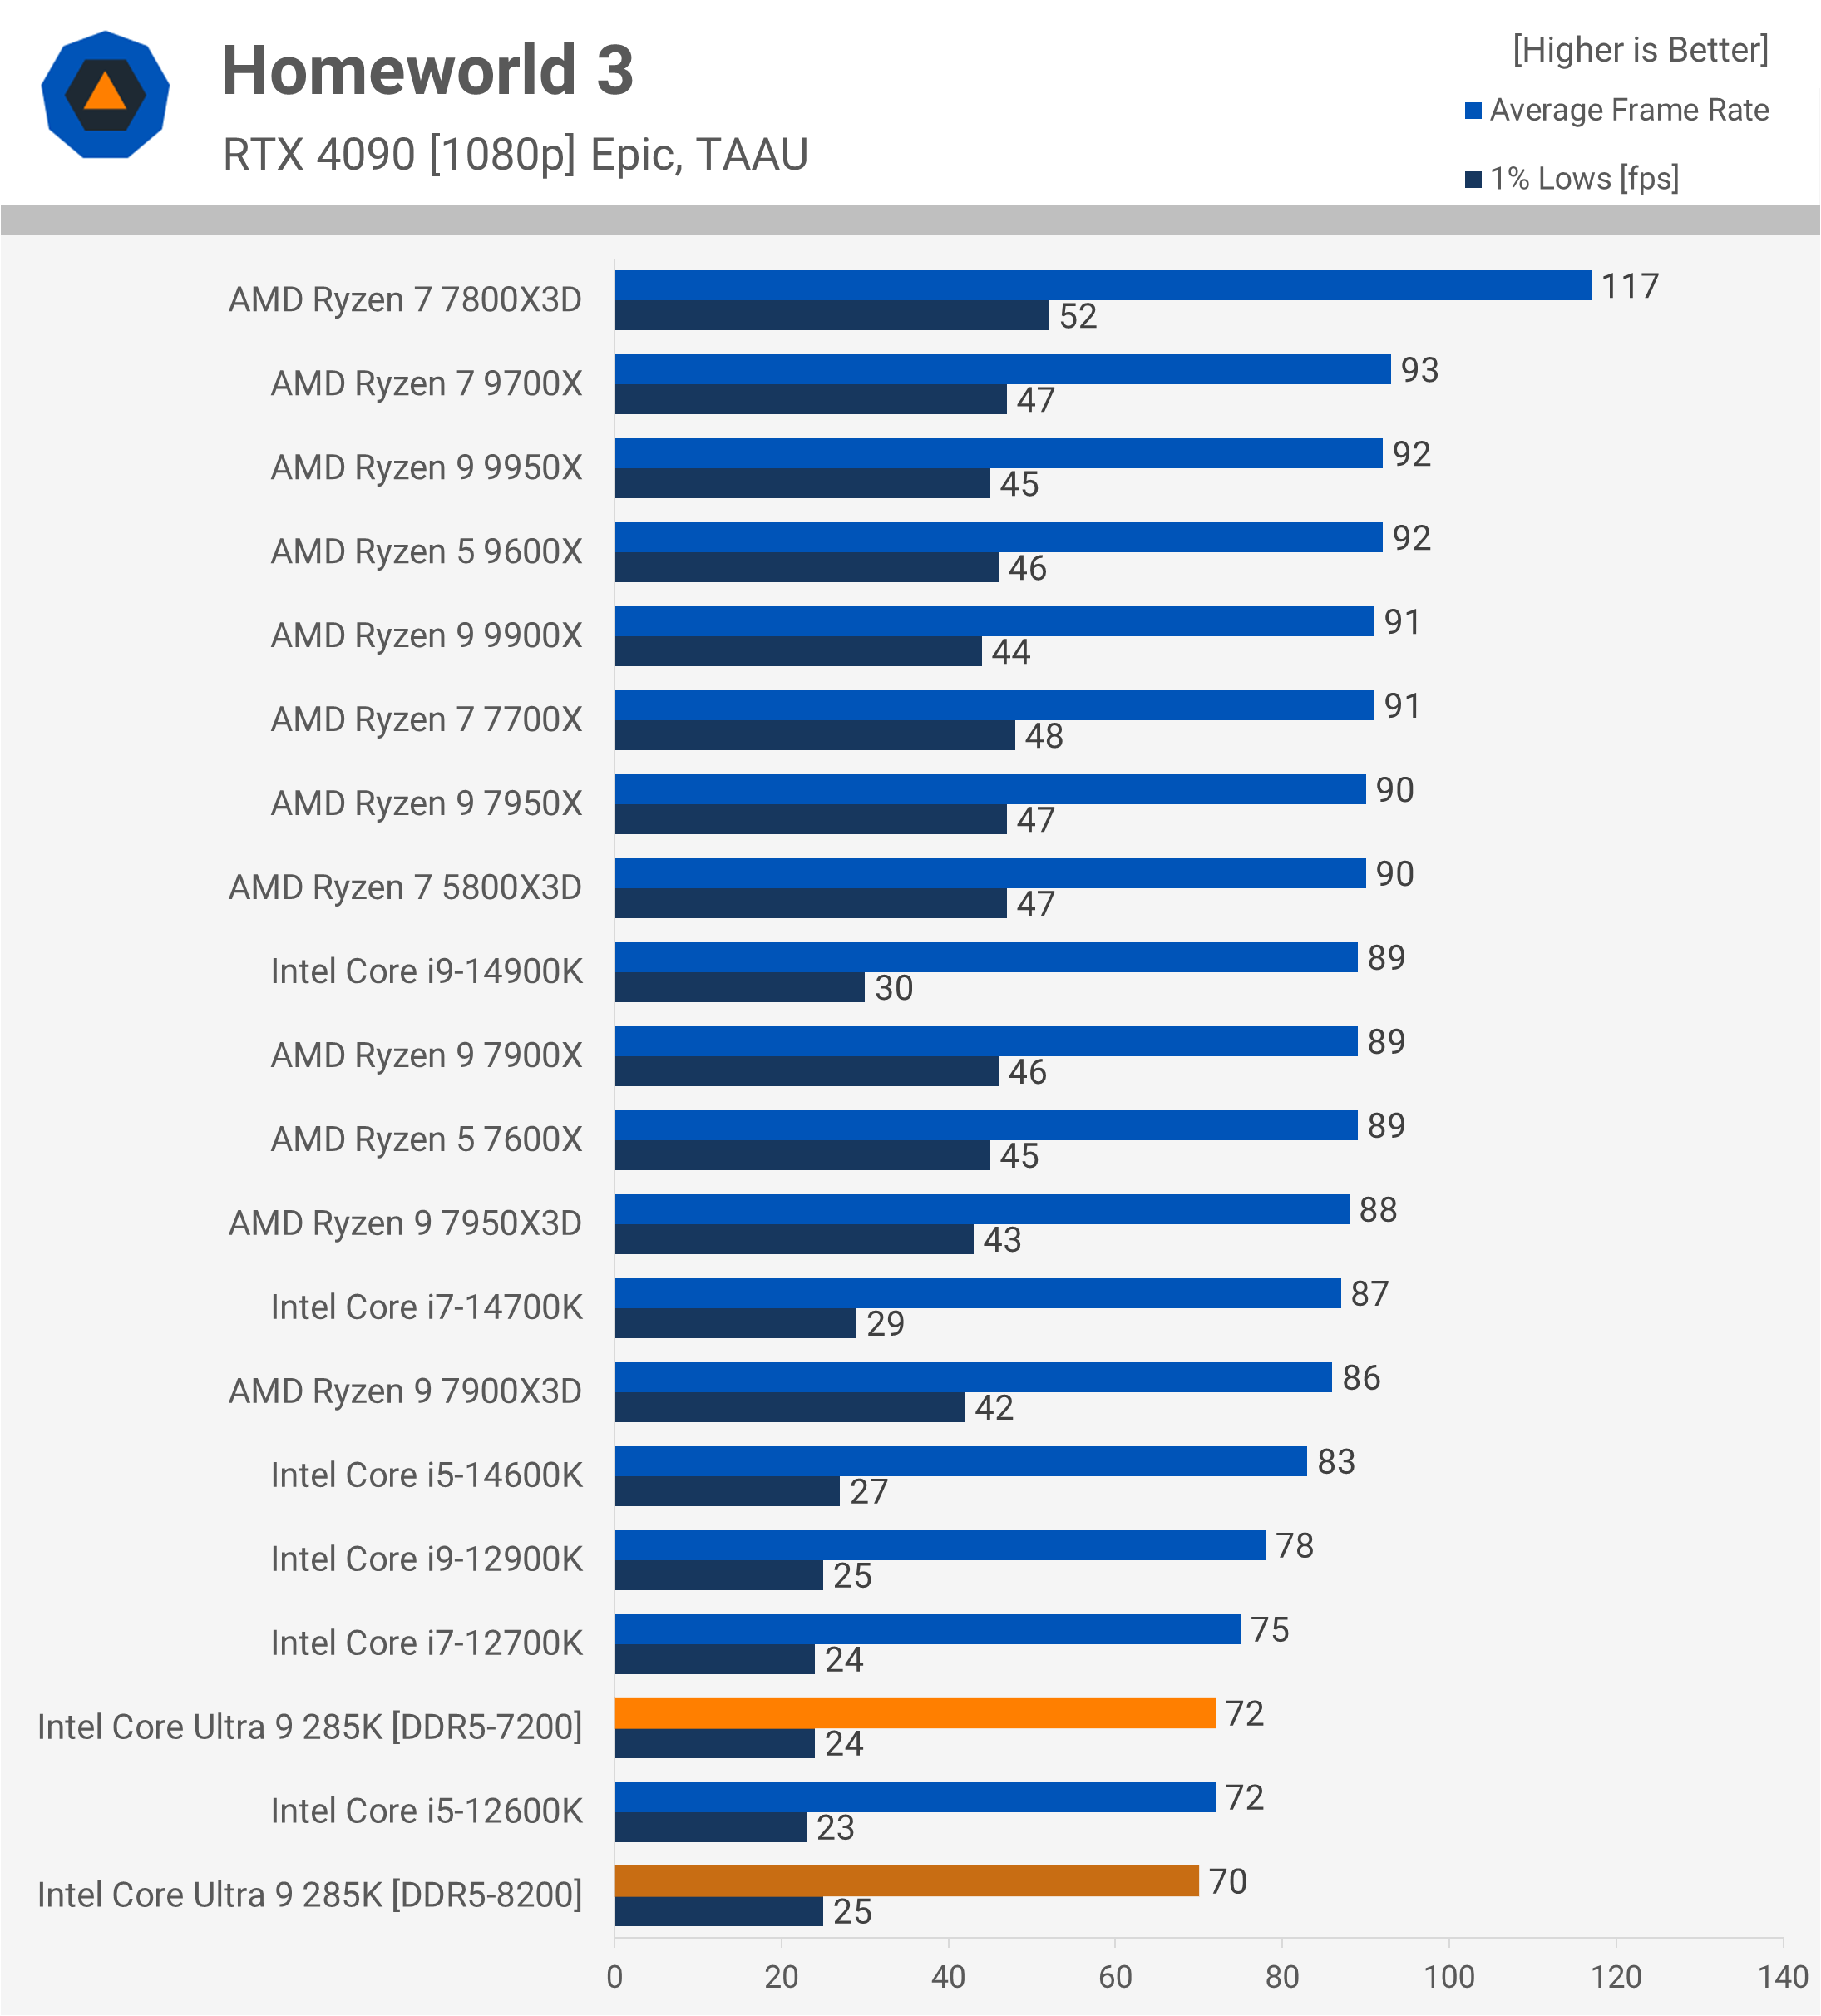
Another game where the 285K’s performance falls to the bottom of the chart is Homeworld 3. In this test, the 285K delivered Core i5-12600K-like performance, making it almost 20% slower than the 14900K and 7950X3D, and at least 23% slower than the 9700X.
A Plague Tale: Requiem
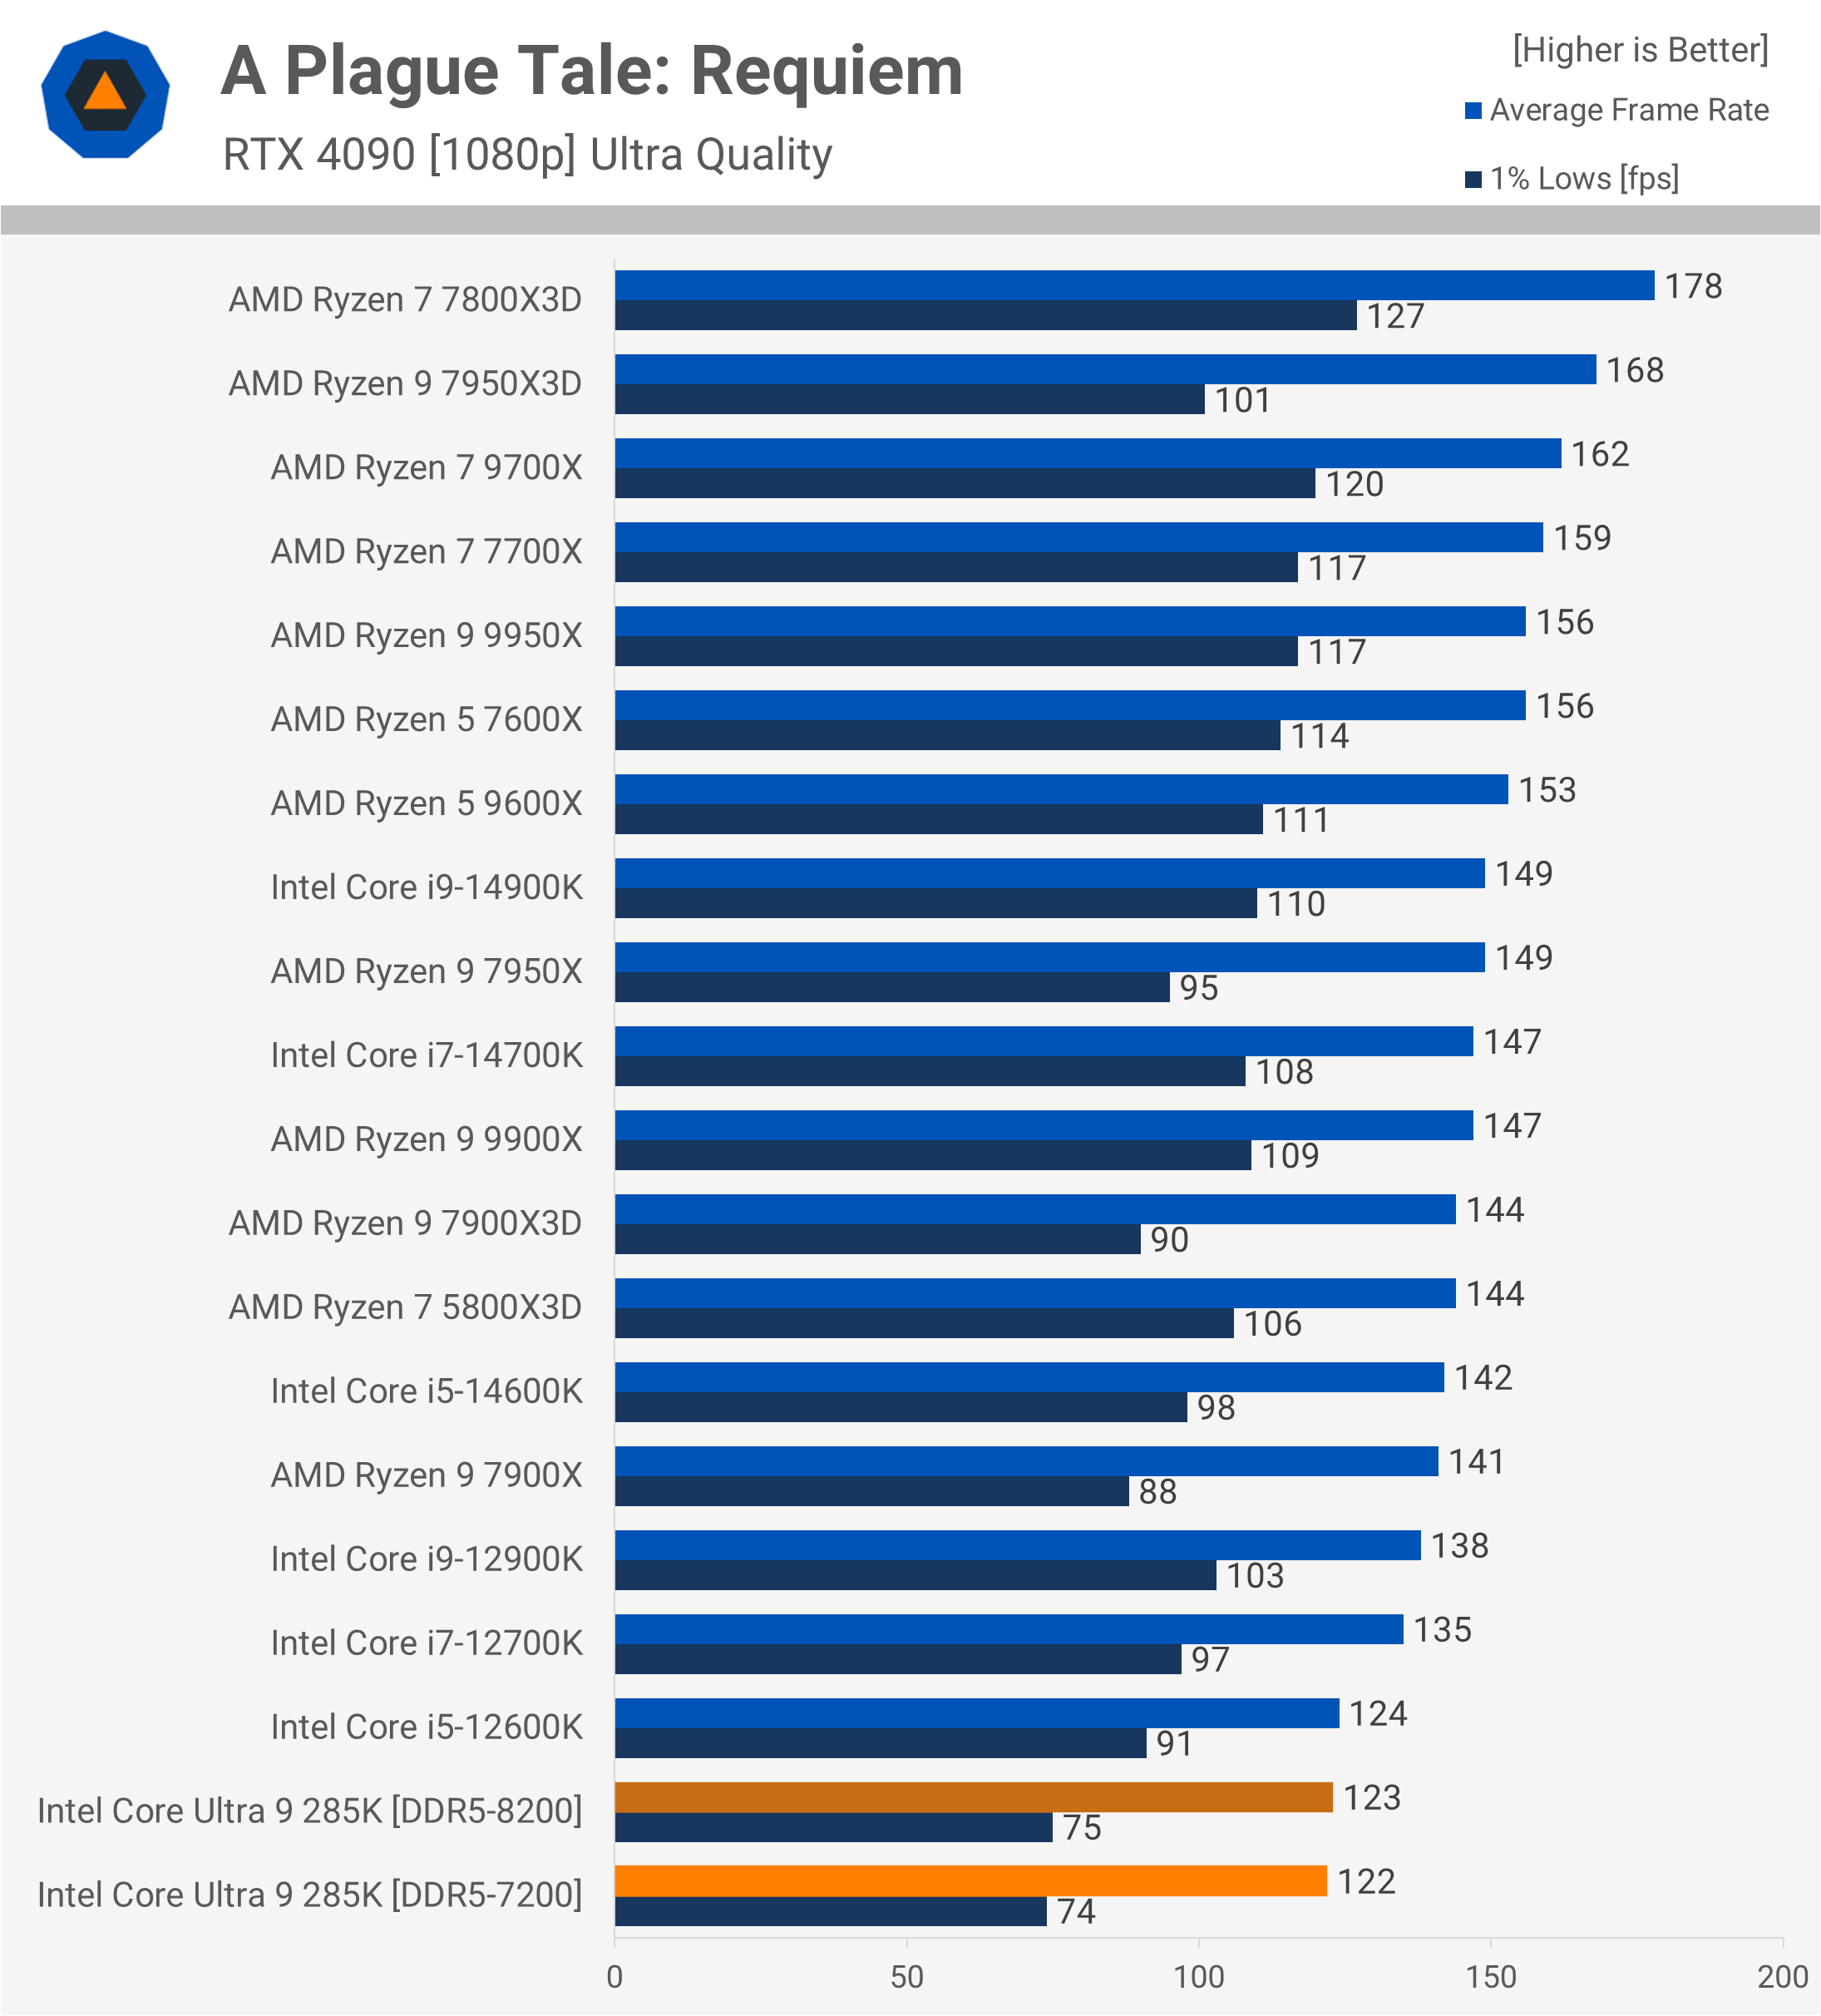
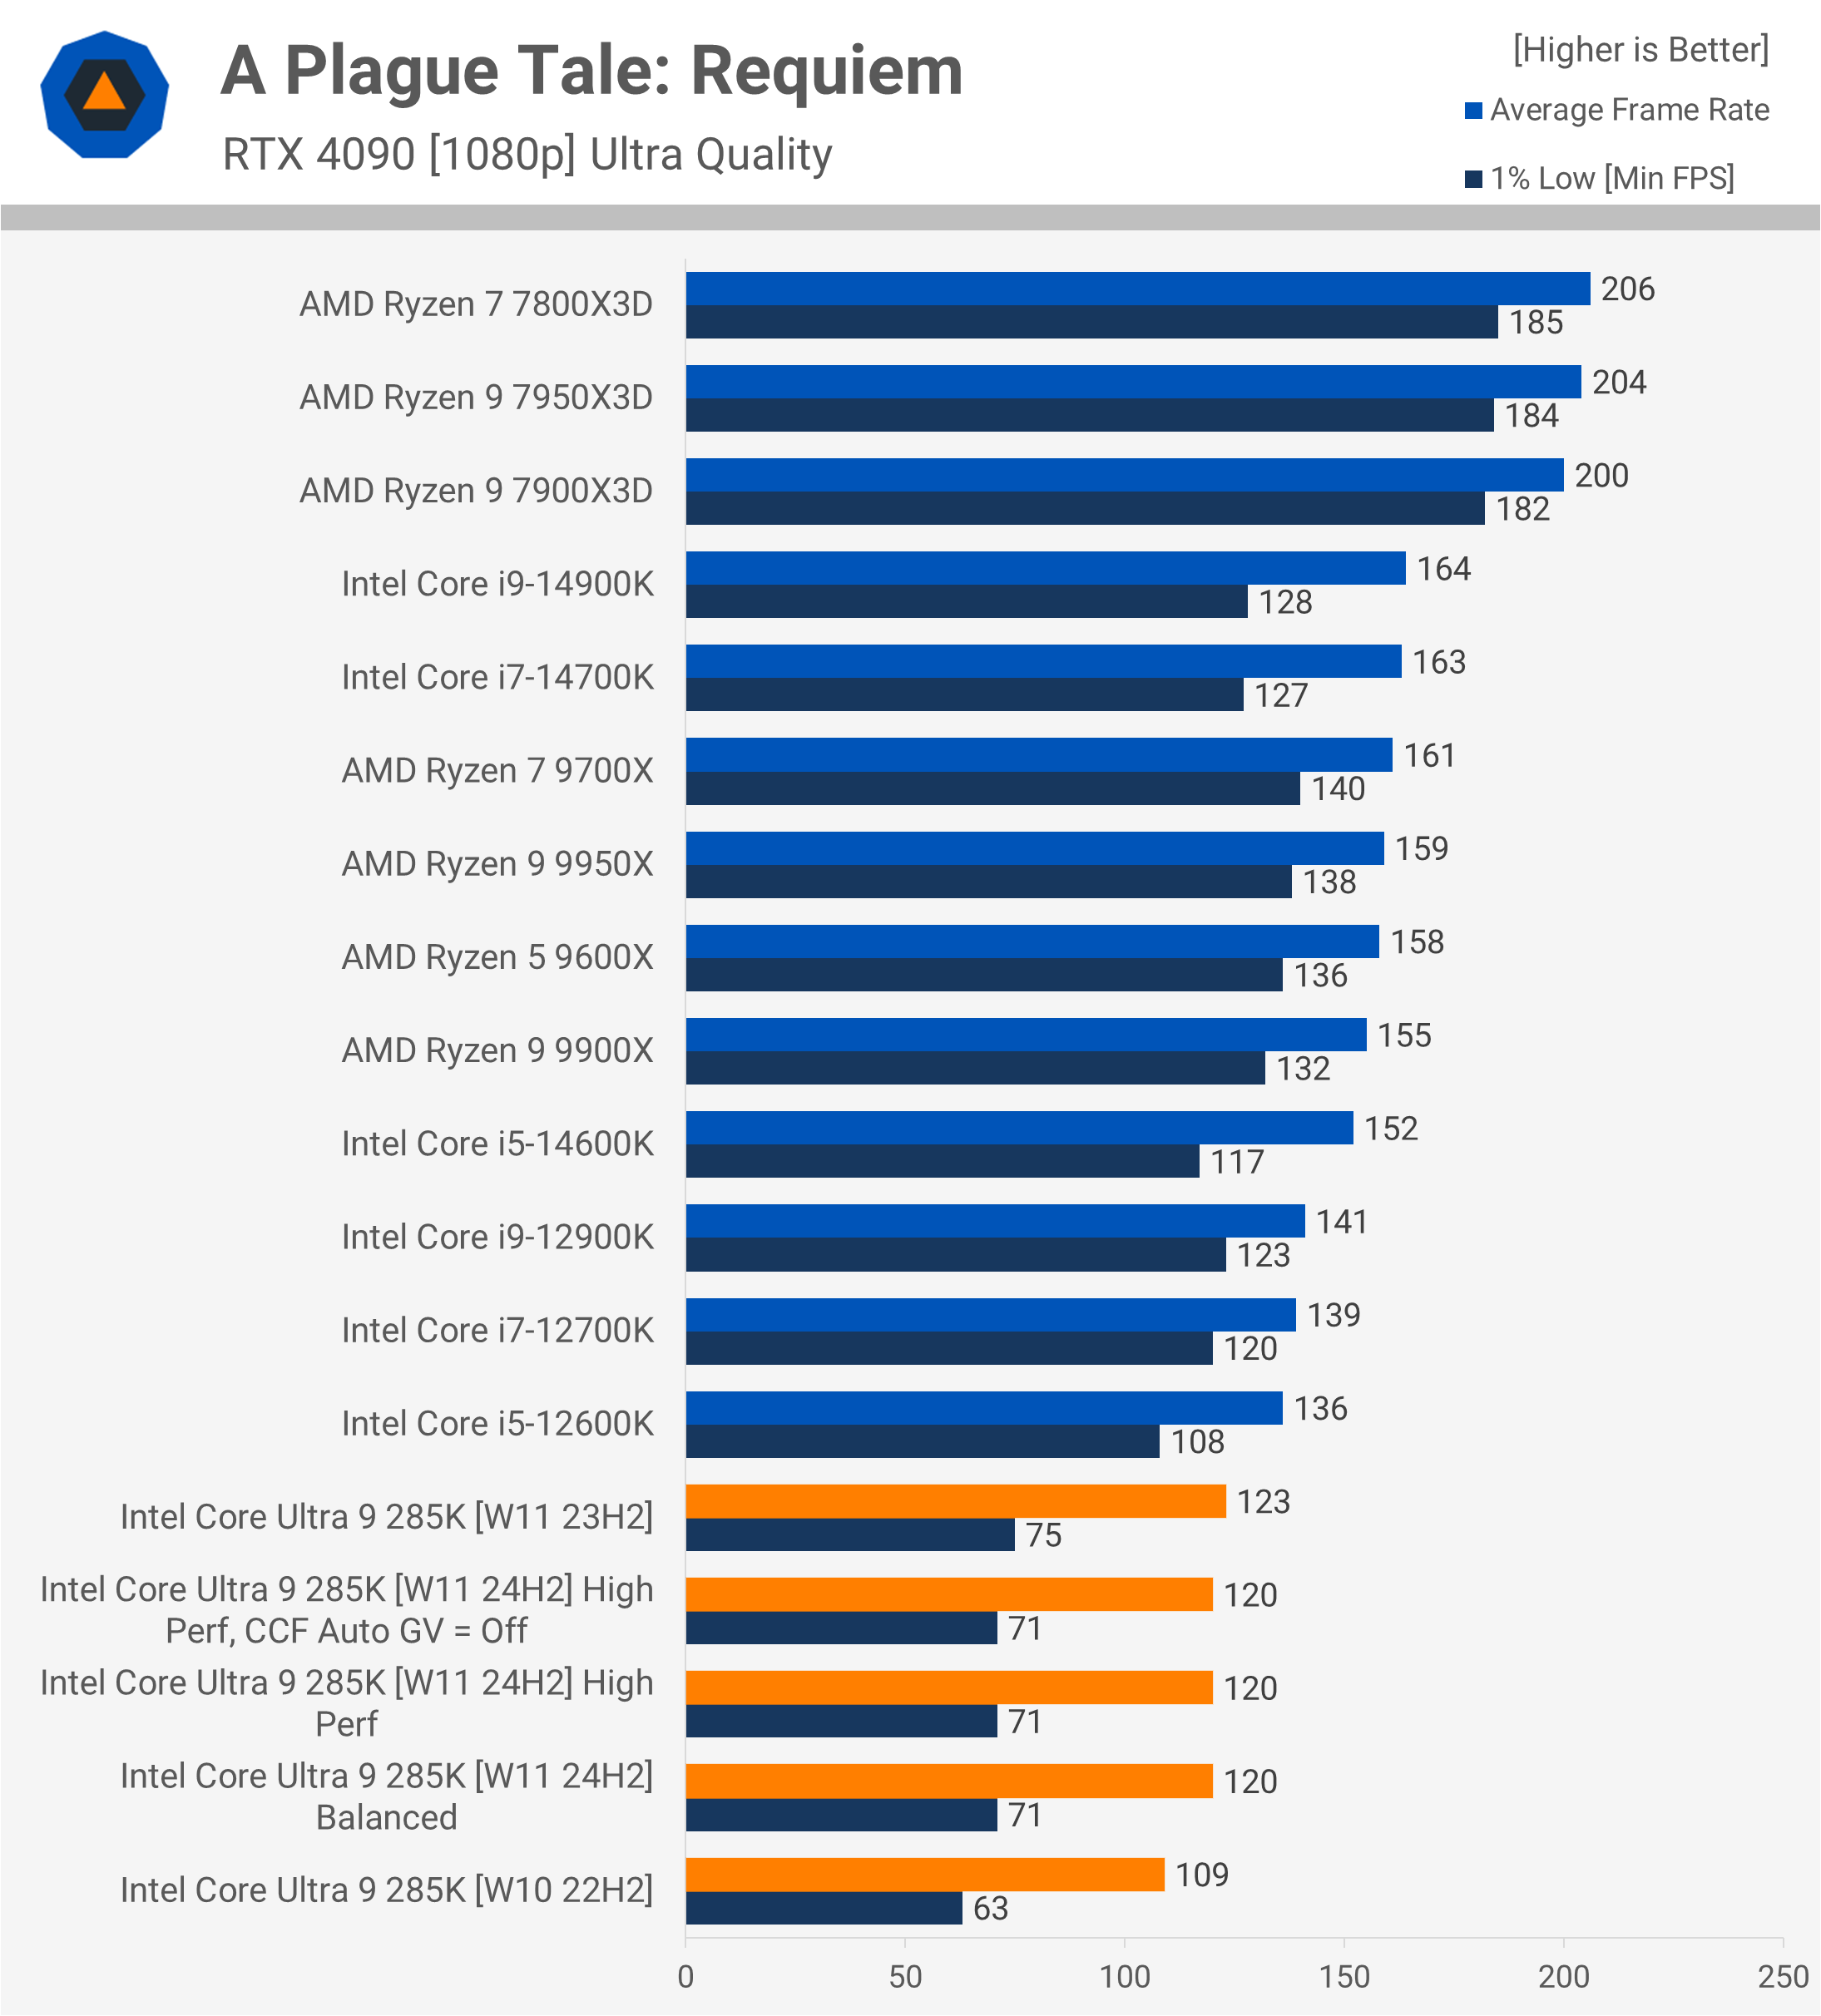
Performance in A Plague Tale: Requiem is also shocking. If you’ve seen other reviews showing much better results in this title, we’ll explain the discrepancy later. For now, the 285K is underwhelming, allowing for just over 120 fps on average, with 1% lows in the mid-70s. It’s at least 17% slower than the 14900K and 27% slower than the 7950X3D, again delivering Core i5-12600K-like performance, making it even slower than the Ryzen 5 7600X.
Counter-Strike 2
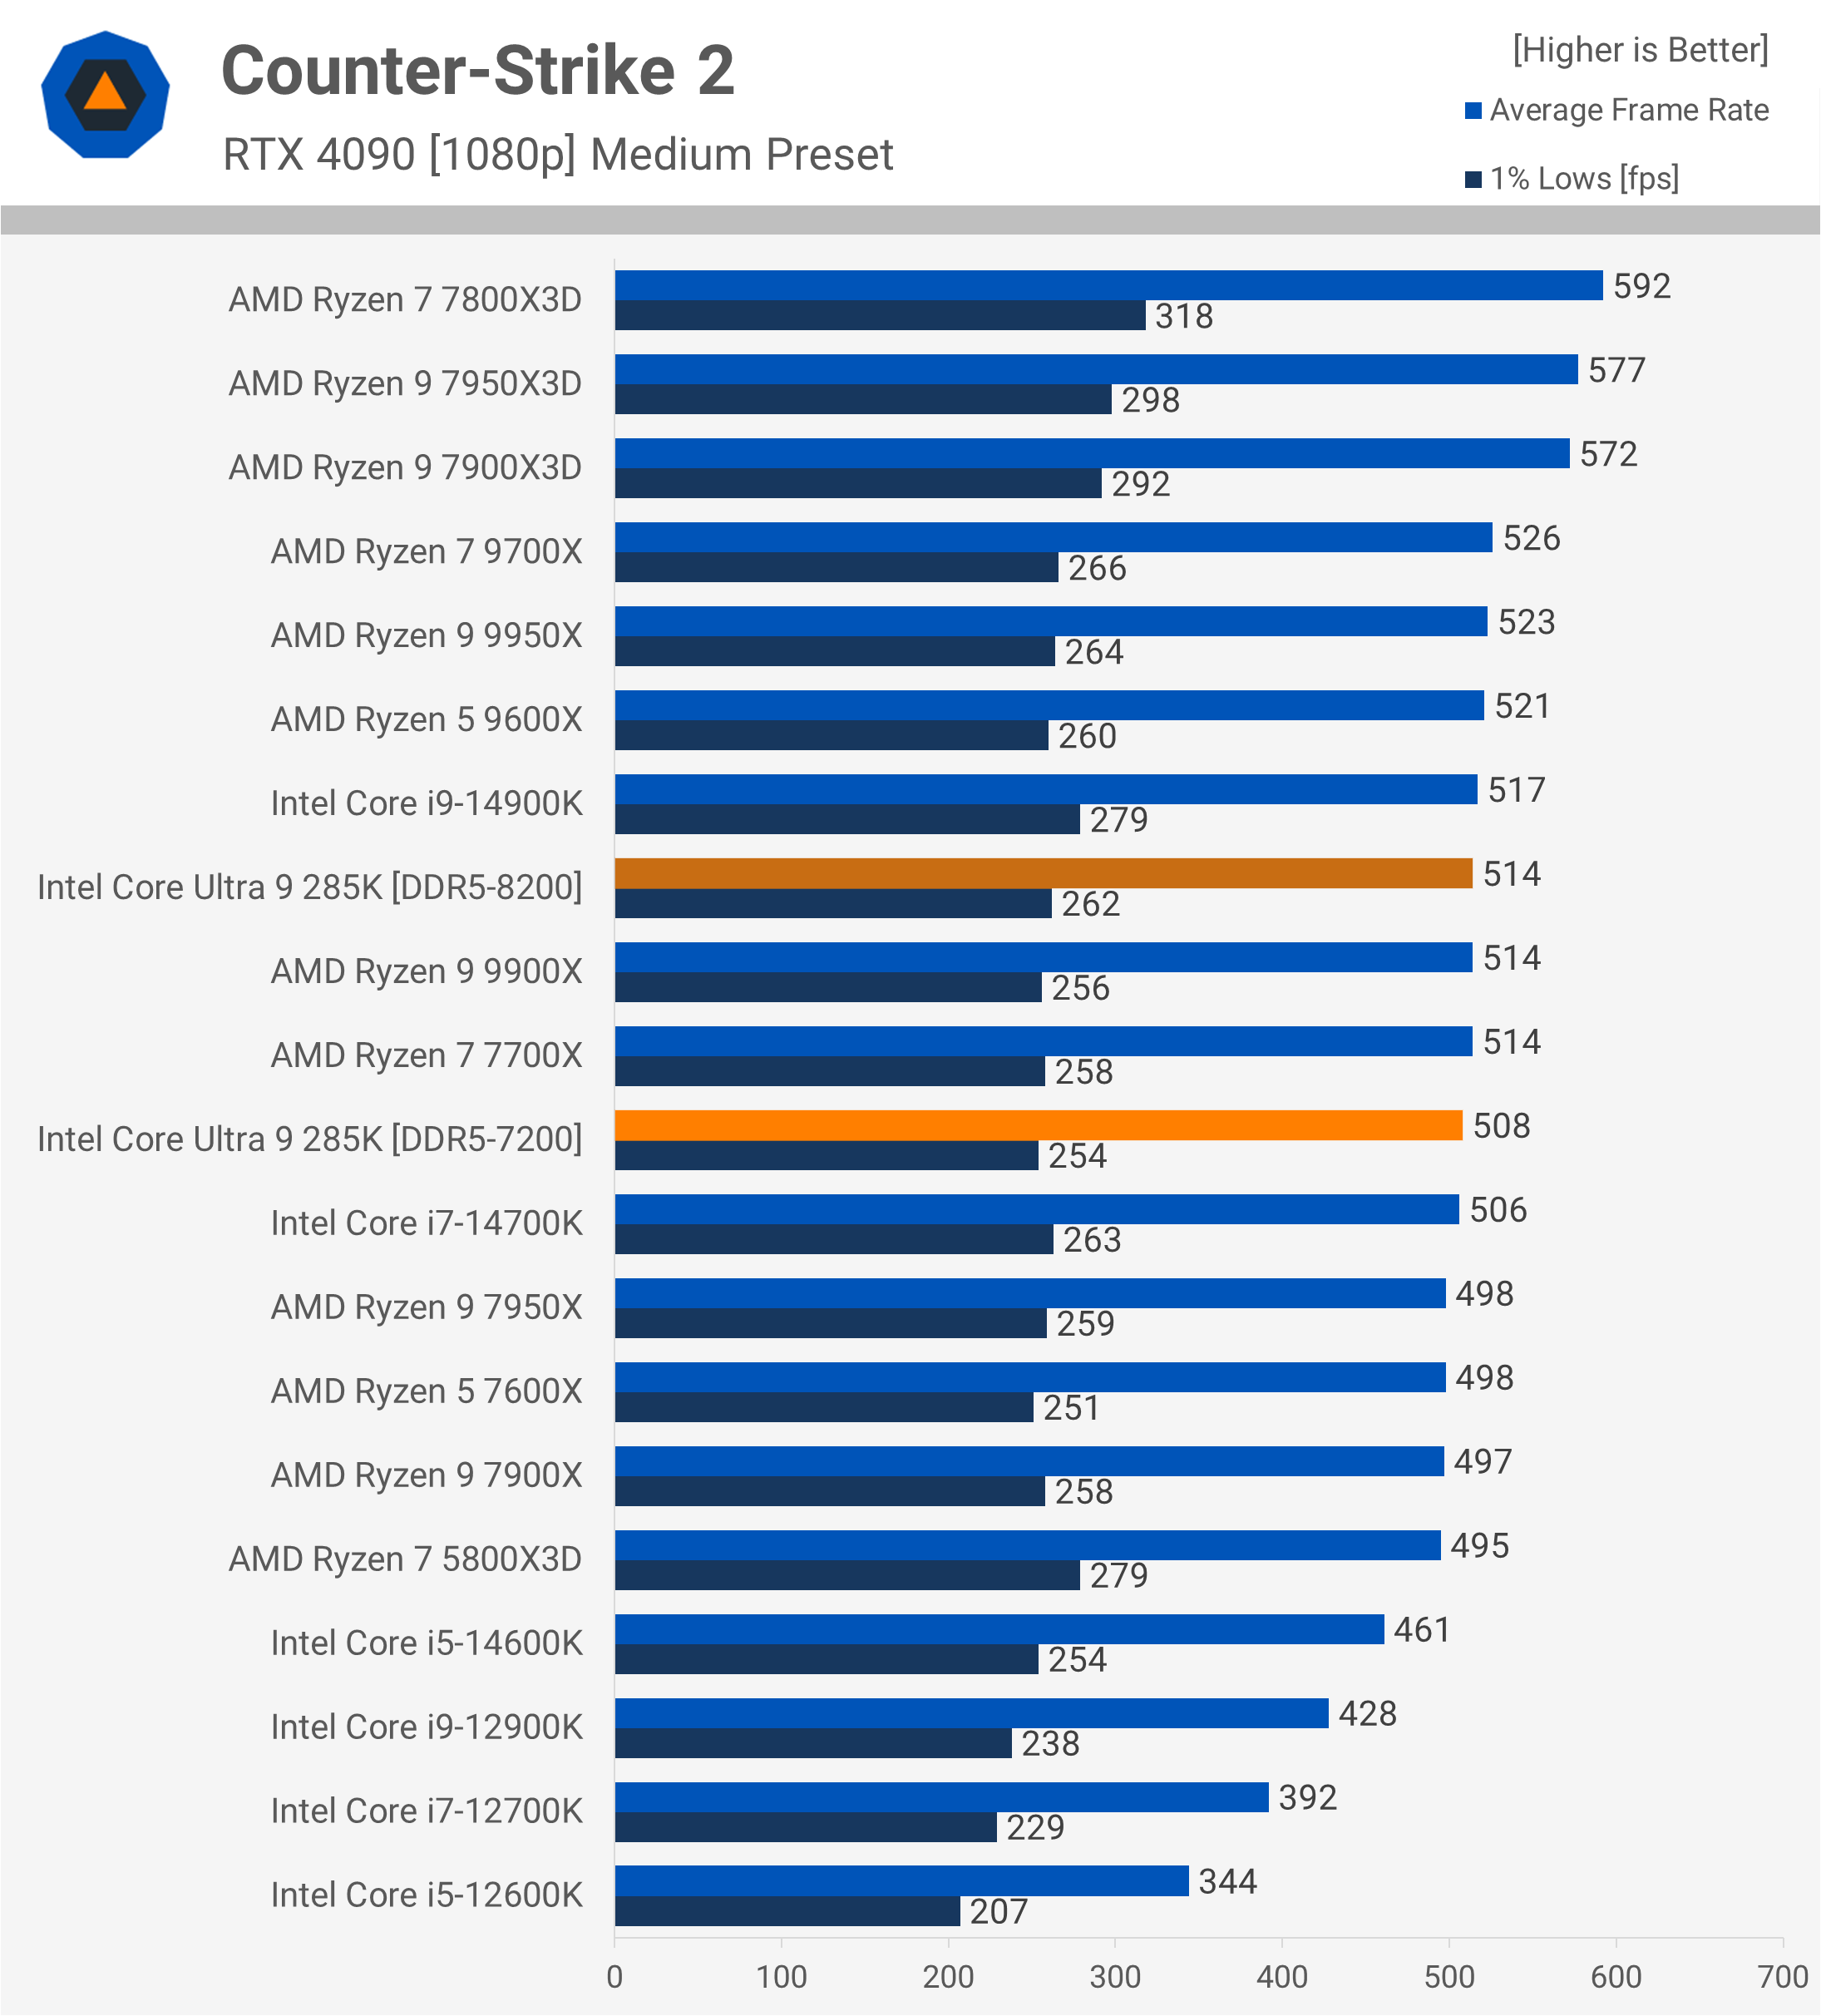
In Counter-Strike 2, the results align more closely with Intel’s promises, with the 285K roughly matching the 14900K. While it’s good to see this kind of parity, it’s far from the norm based on our other tests, and still an underwhelming result overall.
Starfield
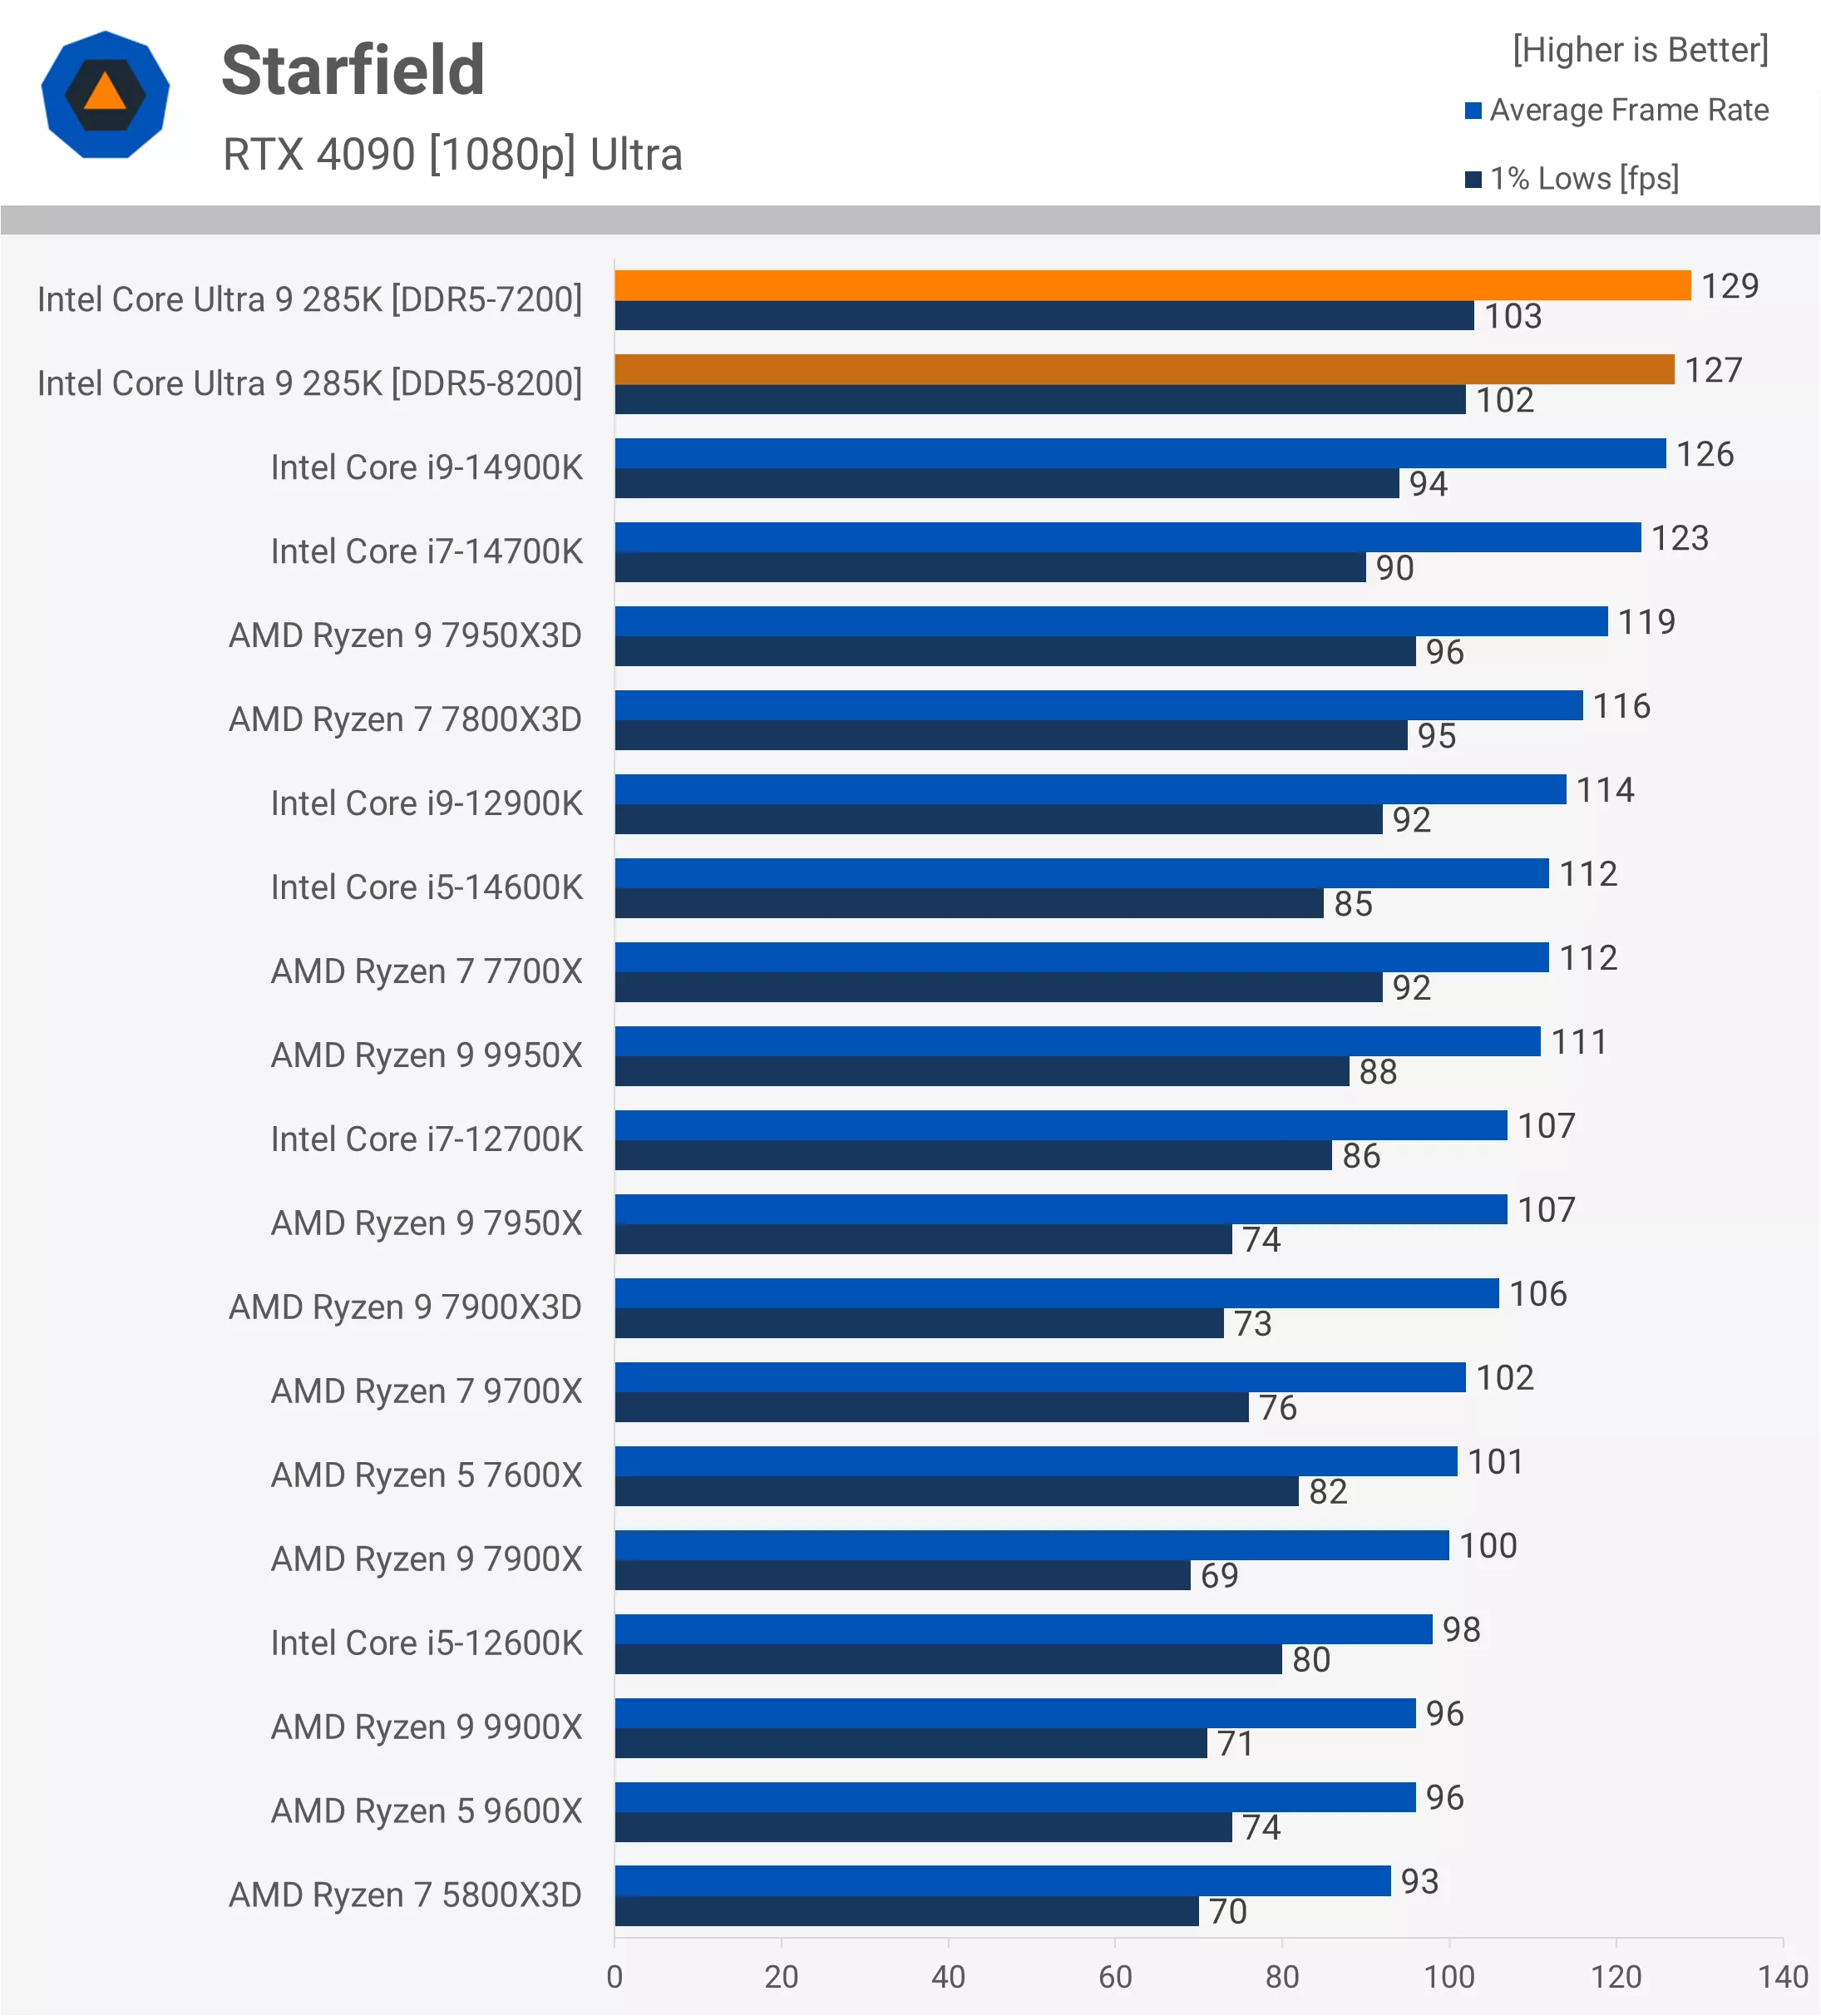
Interestingly, the 285K delivered its best performance in Starfield, narrowly beating the 14900K and even surpassing the 7950X3D. However, using the same memory, it was only 2% faster than the 14900K, which, while one of the better results we’ve seen, is still disappointing for a new generation.
Warhammer 40,000: Space Marine 2
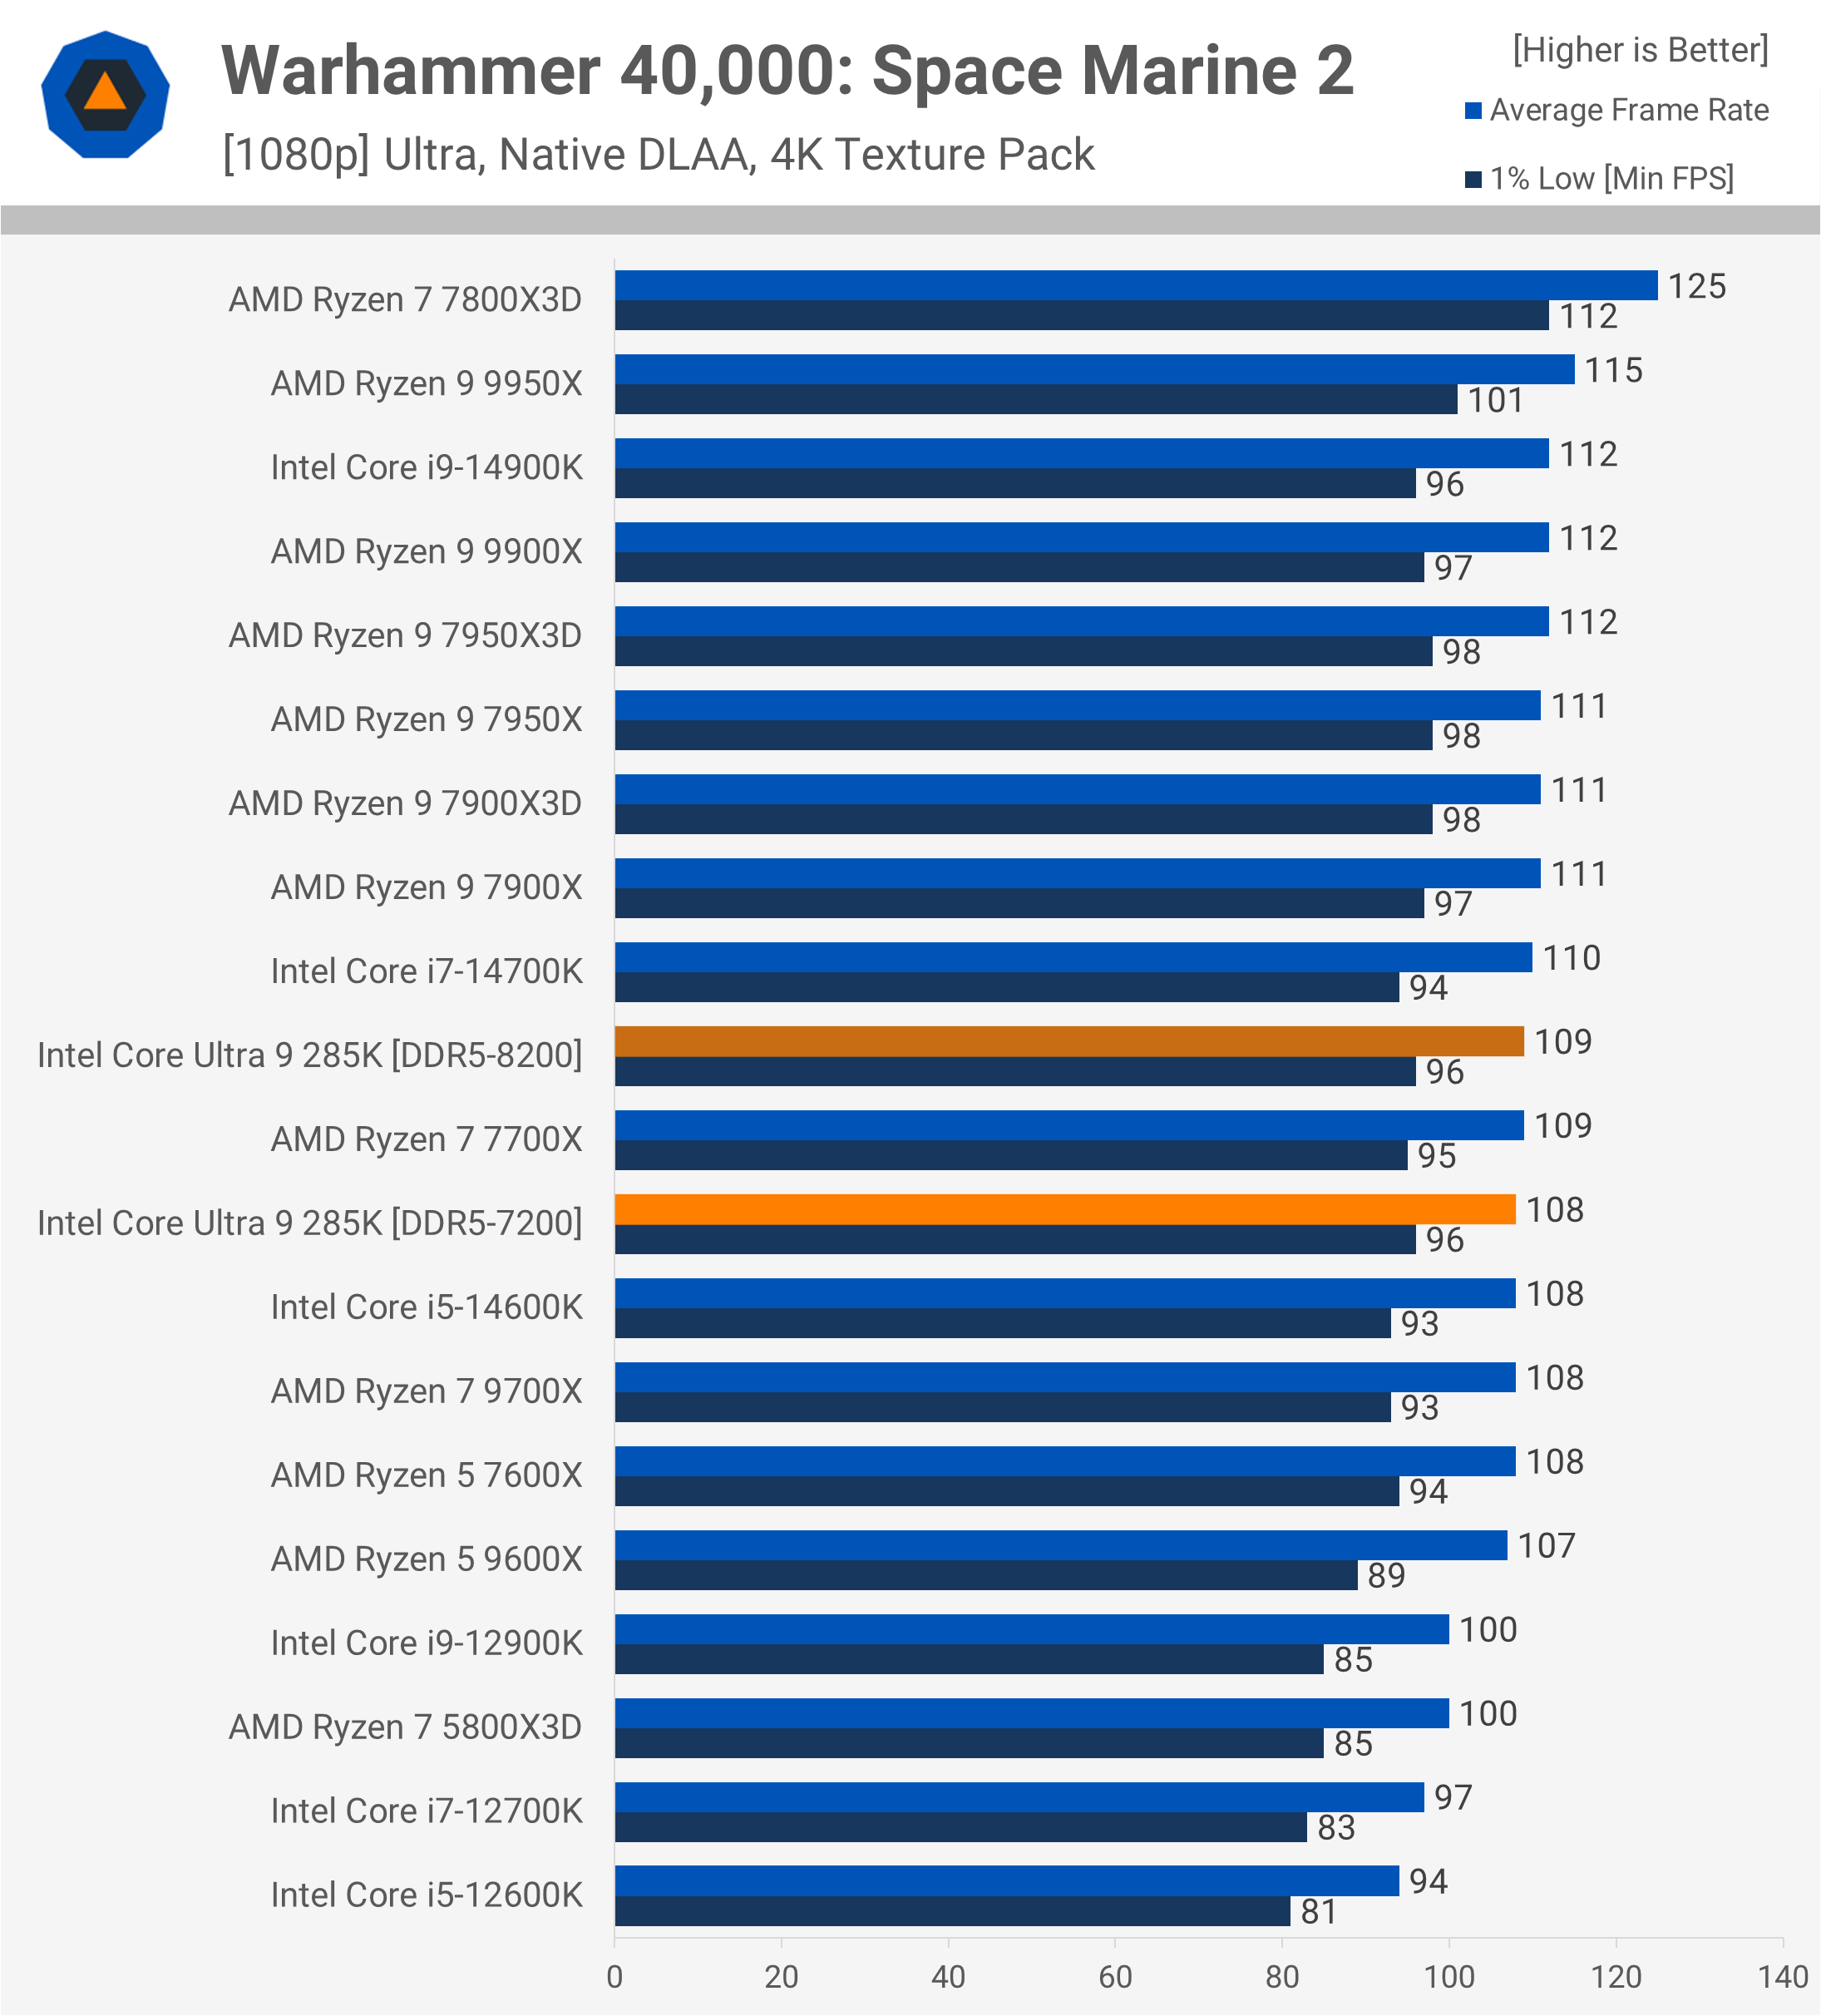
Space Marine 2 ran fine on the 285K, though this new flagship only offered mid-tier performance, coming in slower than the 14700K and roughly matching the Ryzen 7 7700X. It’s not a disaster, but far from impressive.
Hitman 3
The 285K performed decently in Hitman 3, being one of the fastest CPUs in this title. However, it was still slightly slower than the 14900K – by just 2% – so it’s hard to get too excited about this result, as we’re looking at 14700K-like performance.
Watch Dogs: Legion
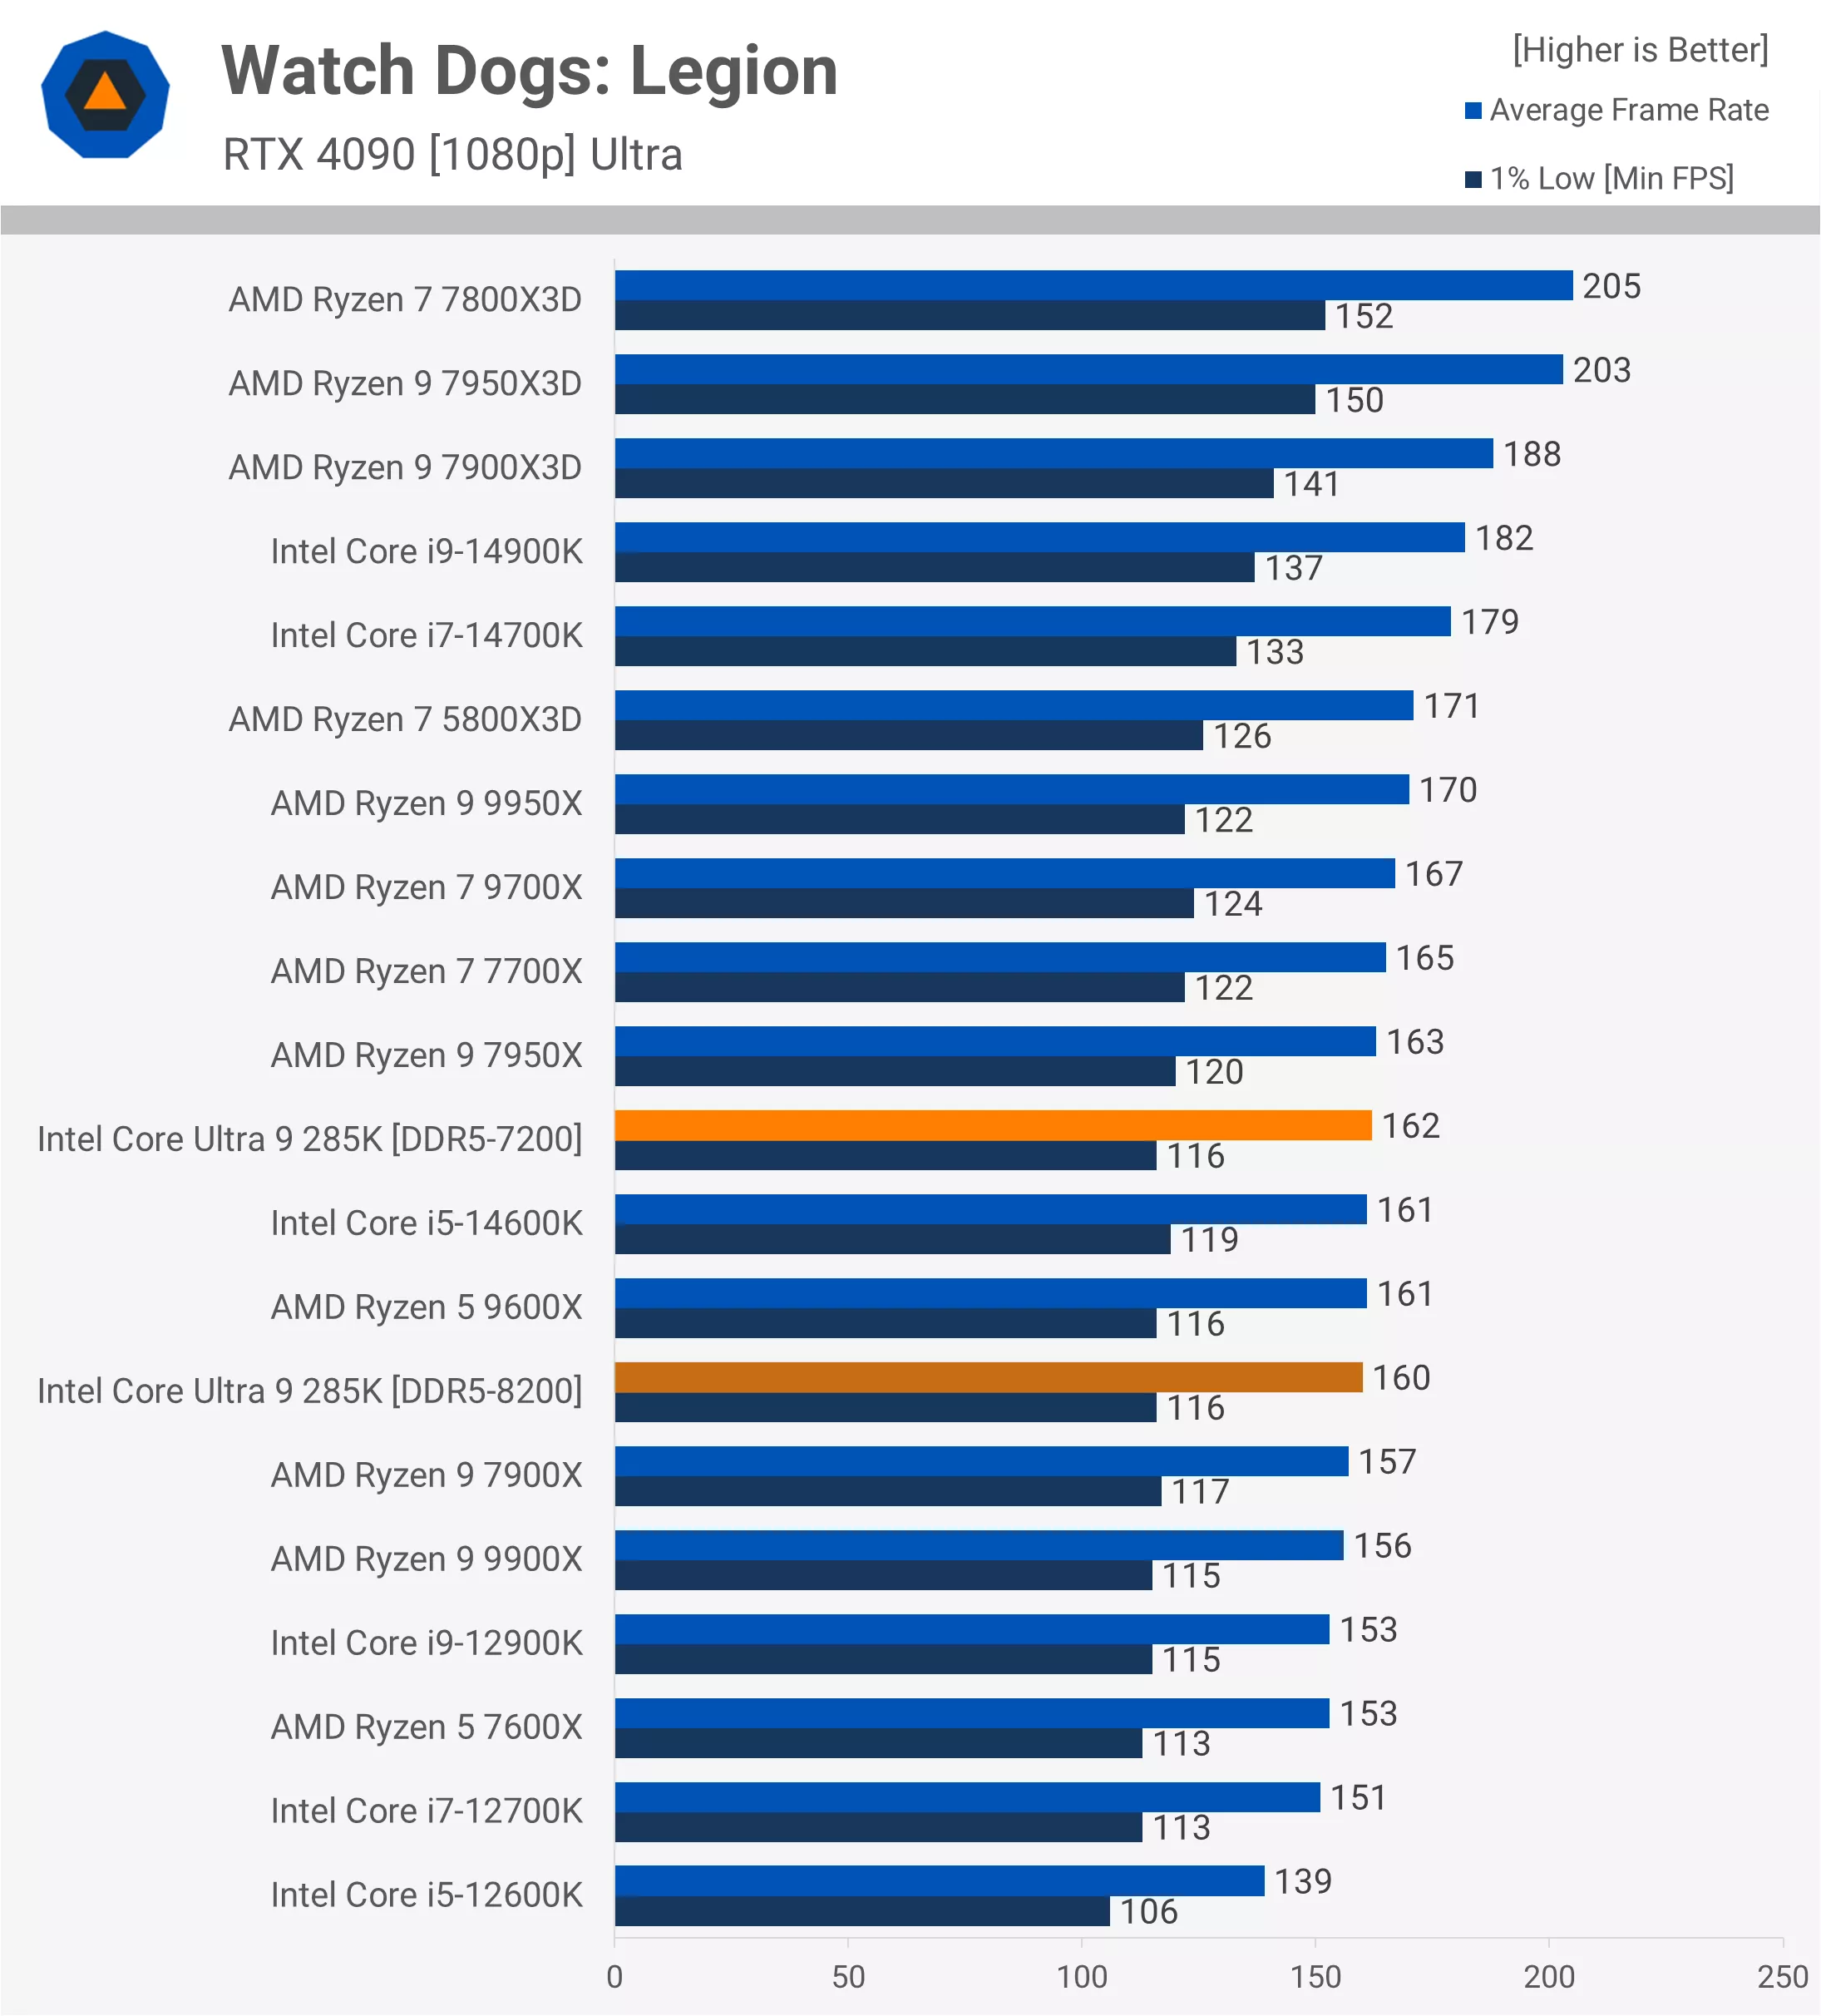
For testing Watch Dogs: Legion, we used the built-in benchmark, but averaged the data from six runs, as the initial results are often inflated. To accurately compare with this data, you’ll need to take an average of six back-to-back runs.
Doing so reveals extremely disappointing results for the 285K, which only matched the 14600K and 9600X with 162 fps on average. This made it 11% slower than the 14900K and 20% slower than the 7950X3D.
Star Wars Outlaws
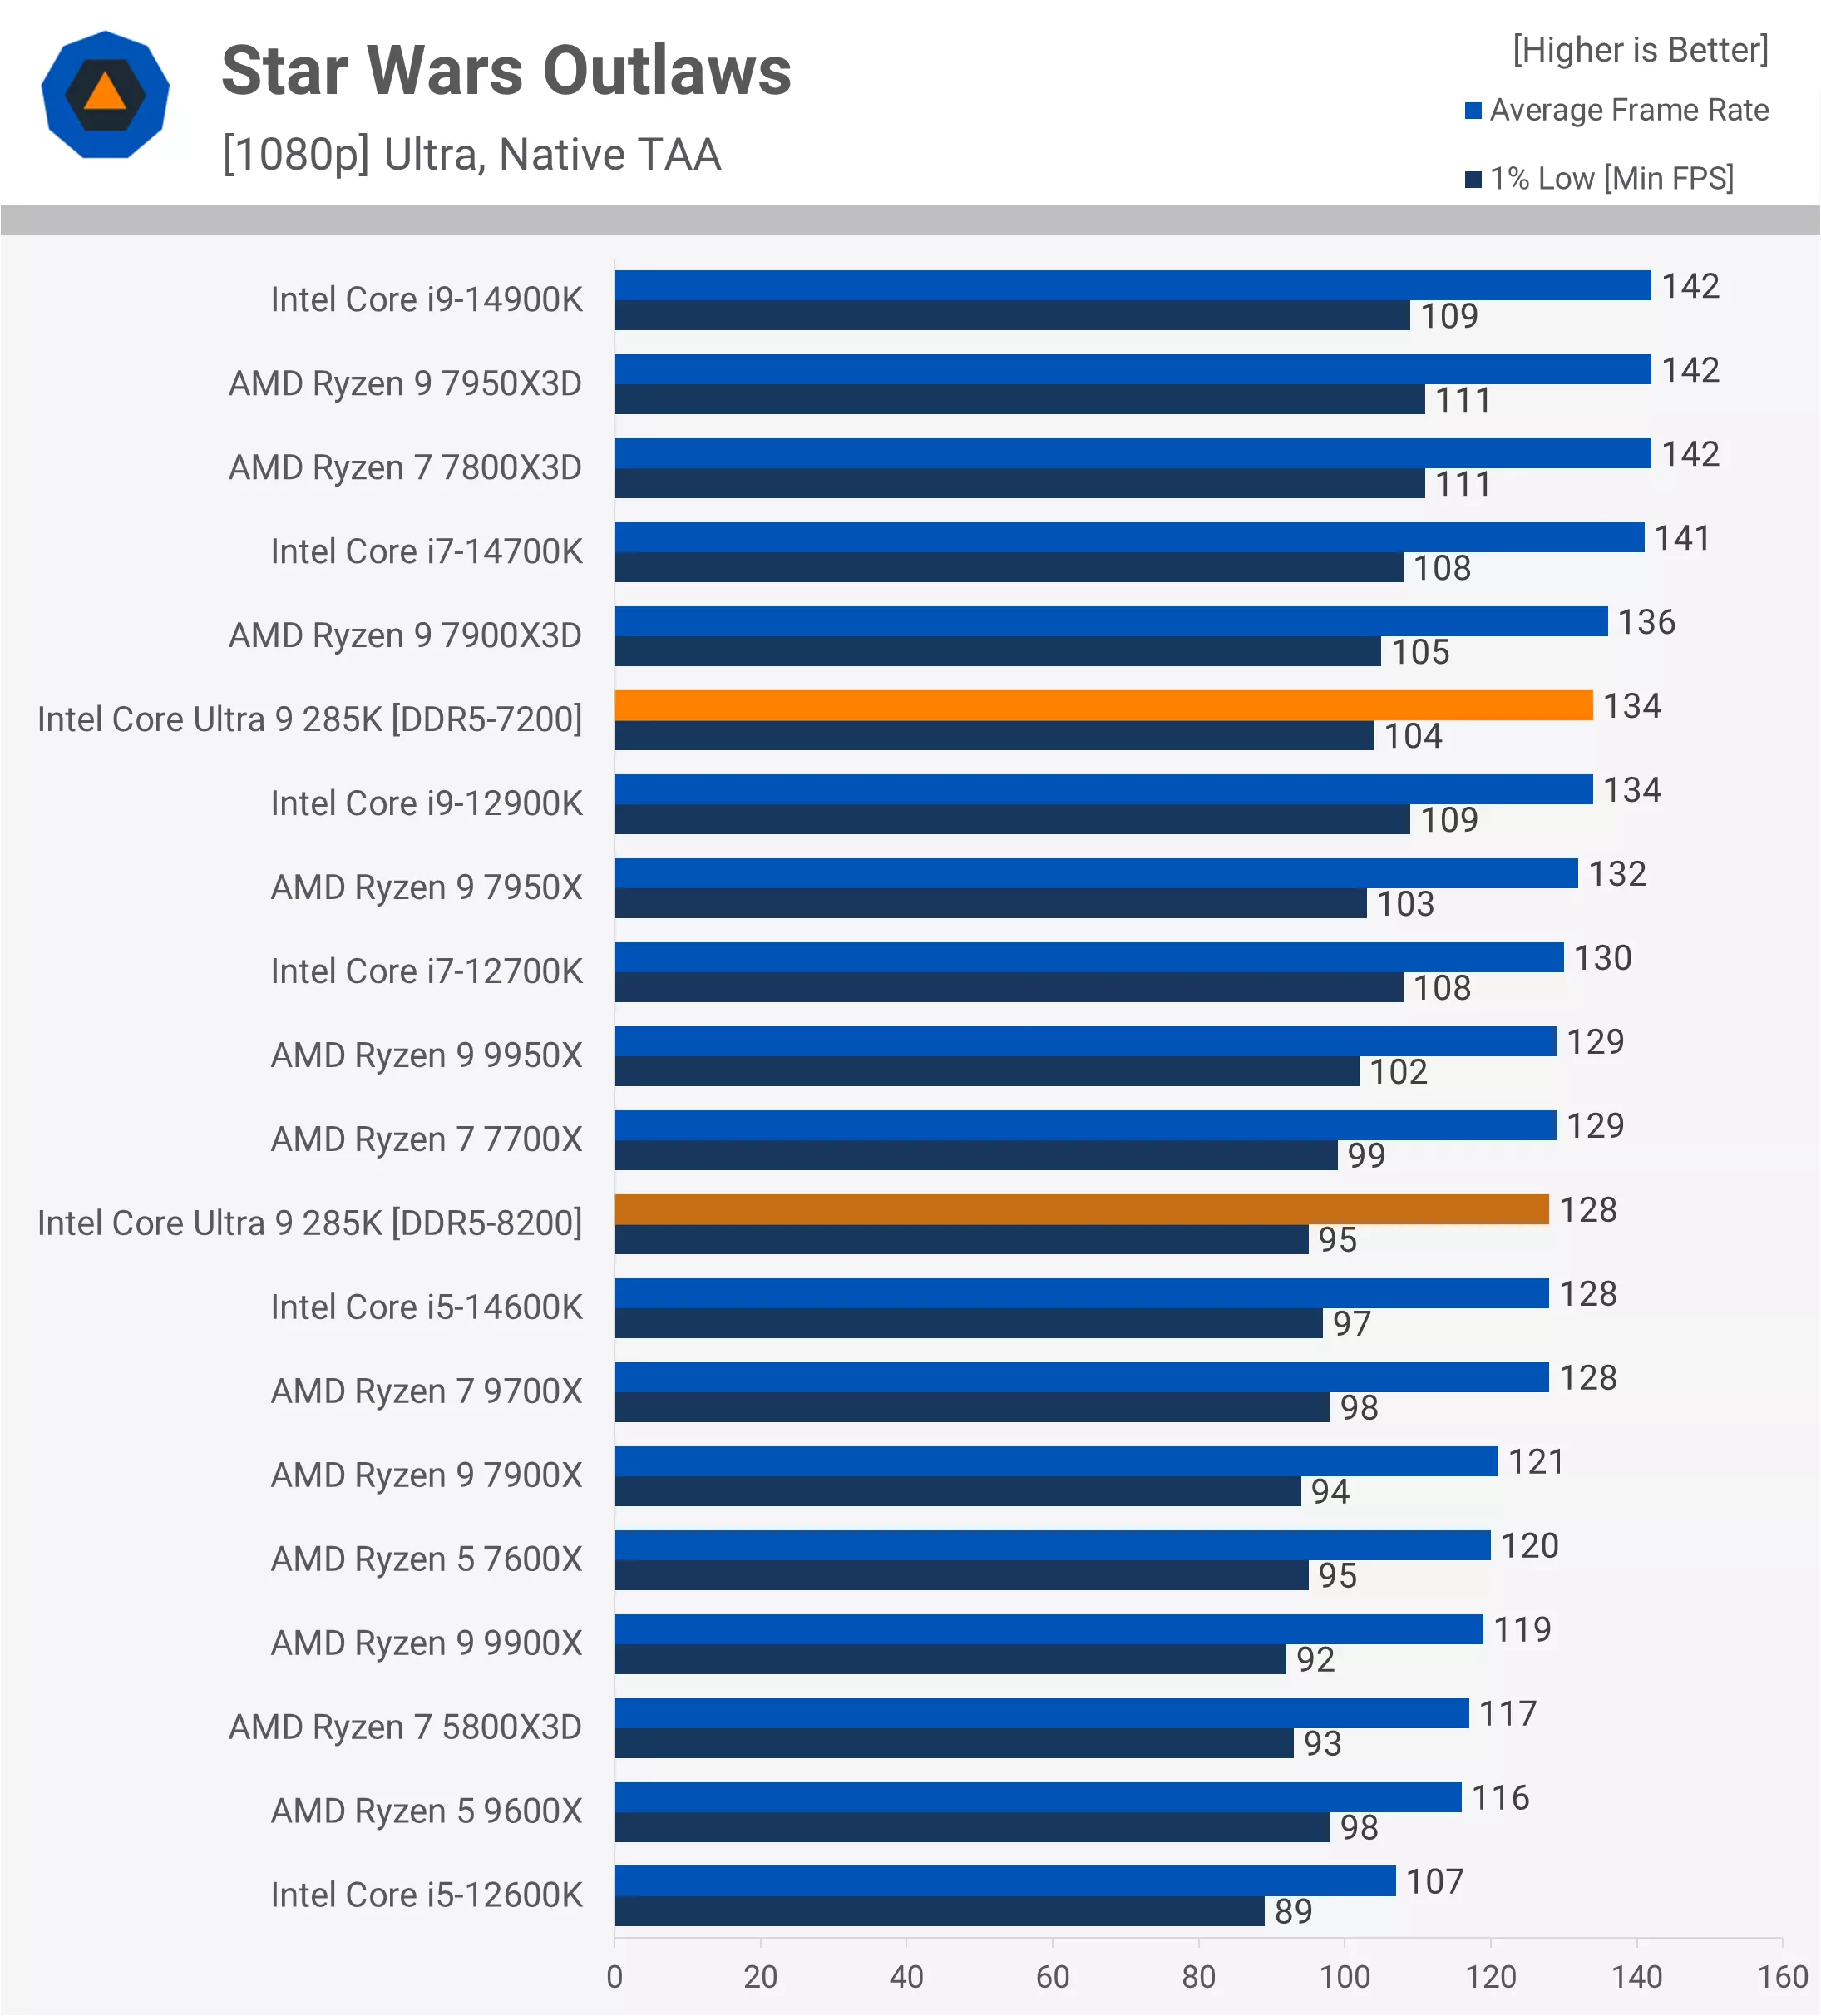
Finally, in Star Wars Outlaws, the lower-latency DDR5-7200 memory provided the best results, with 134 fps – the same performance level as the 12900K. And with that, we conclude our highly disappointing gaming benchmarks.
Side-by-Side Data
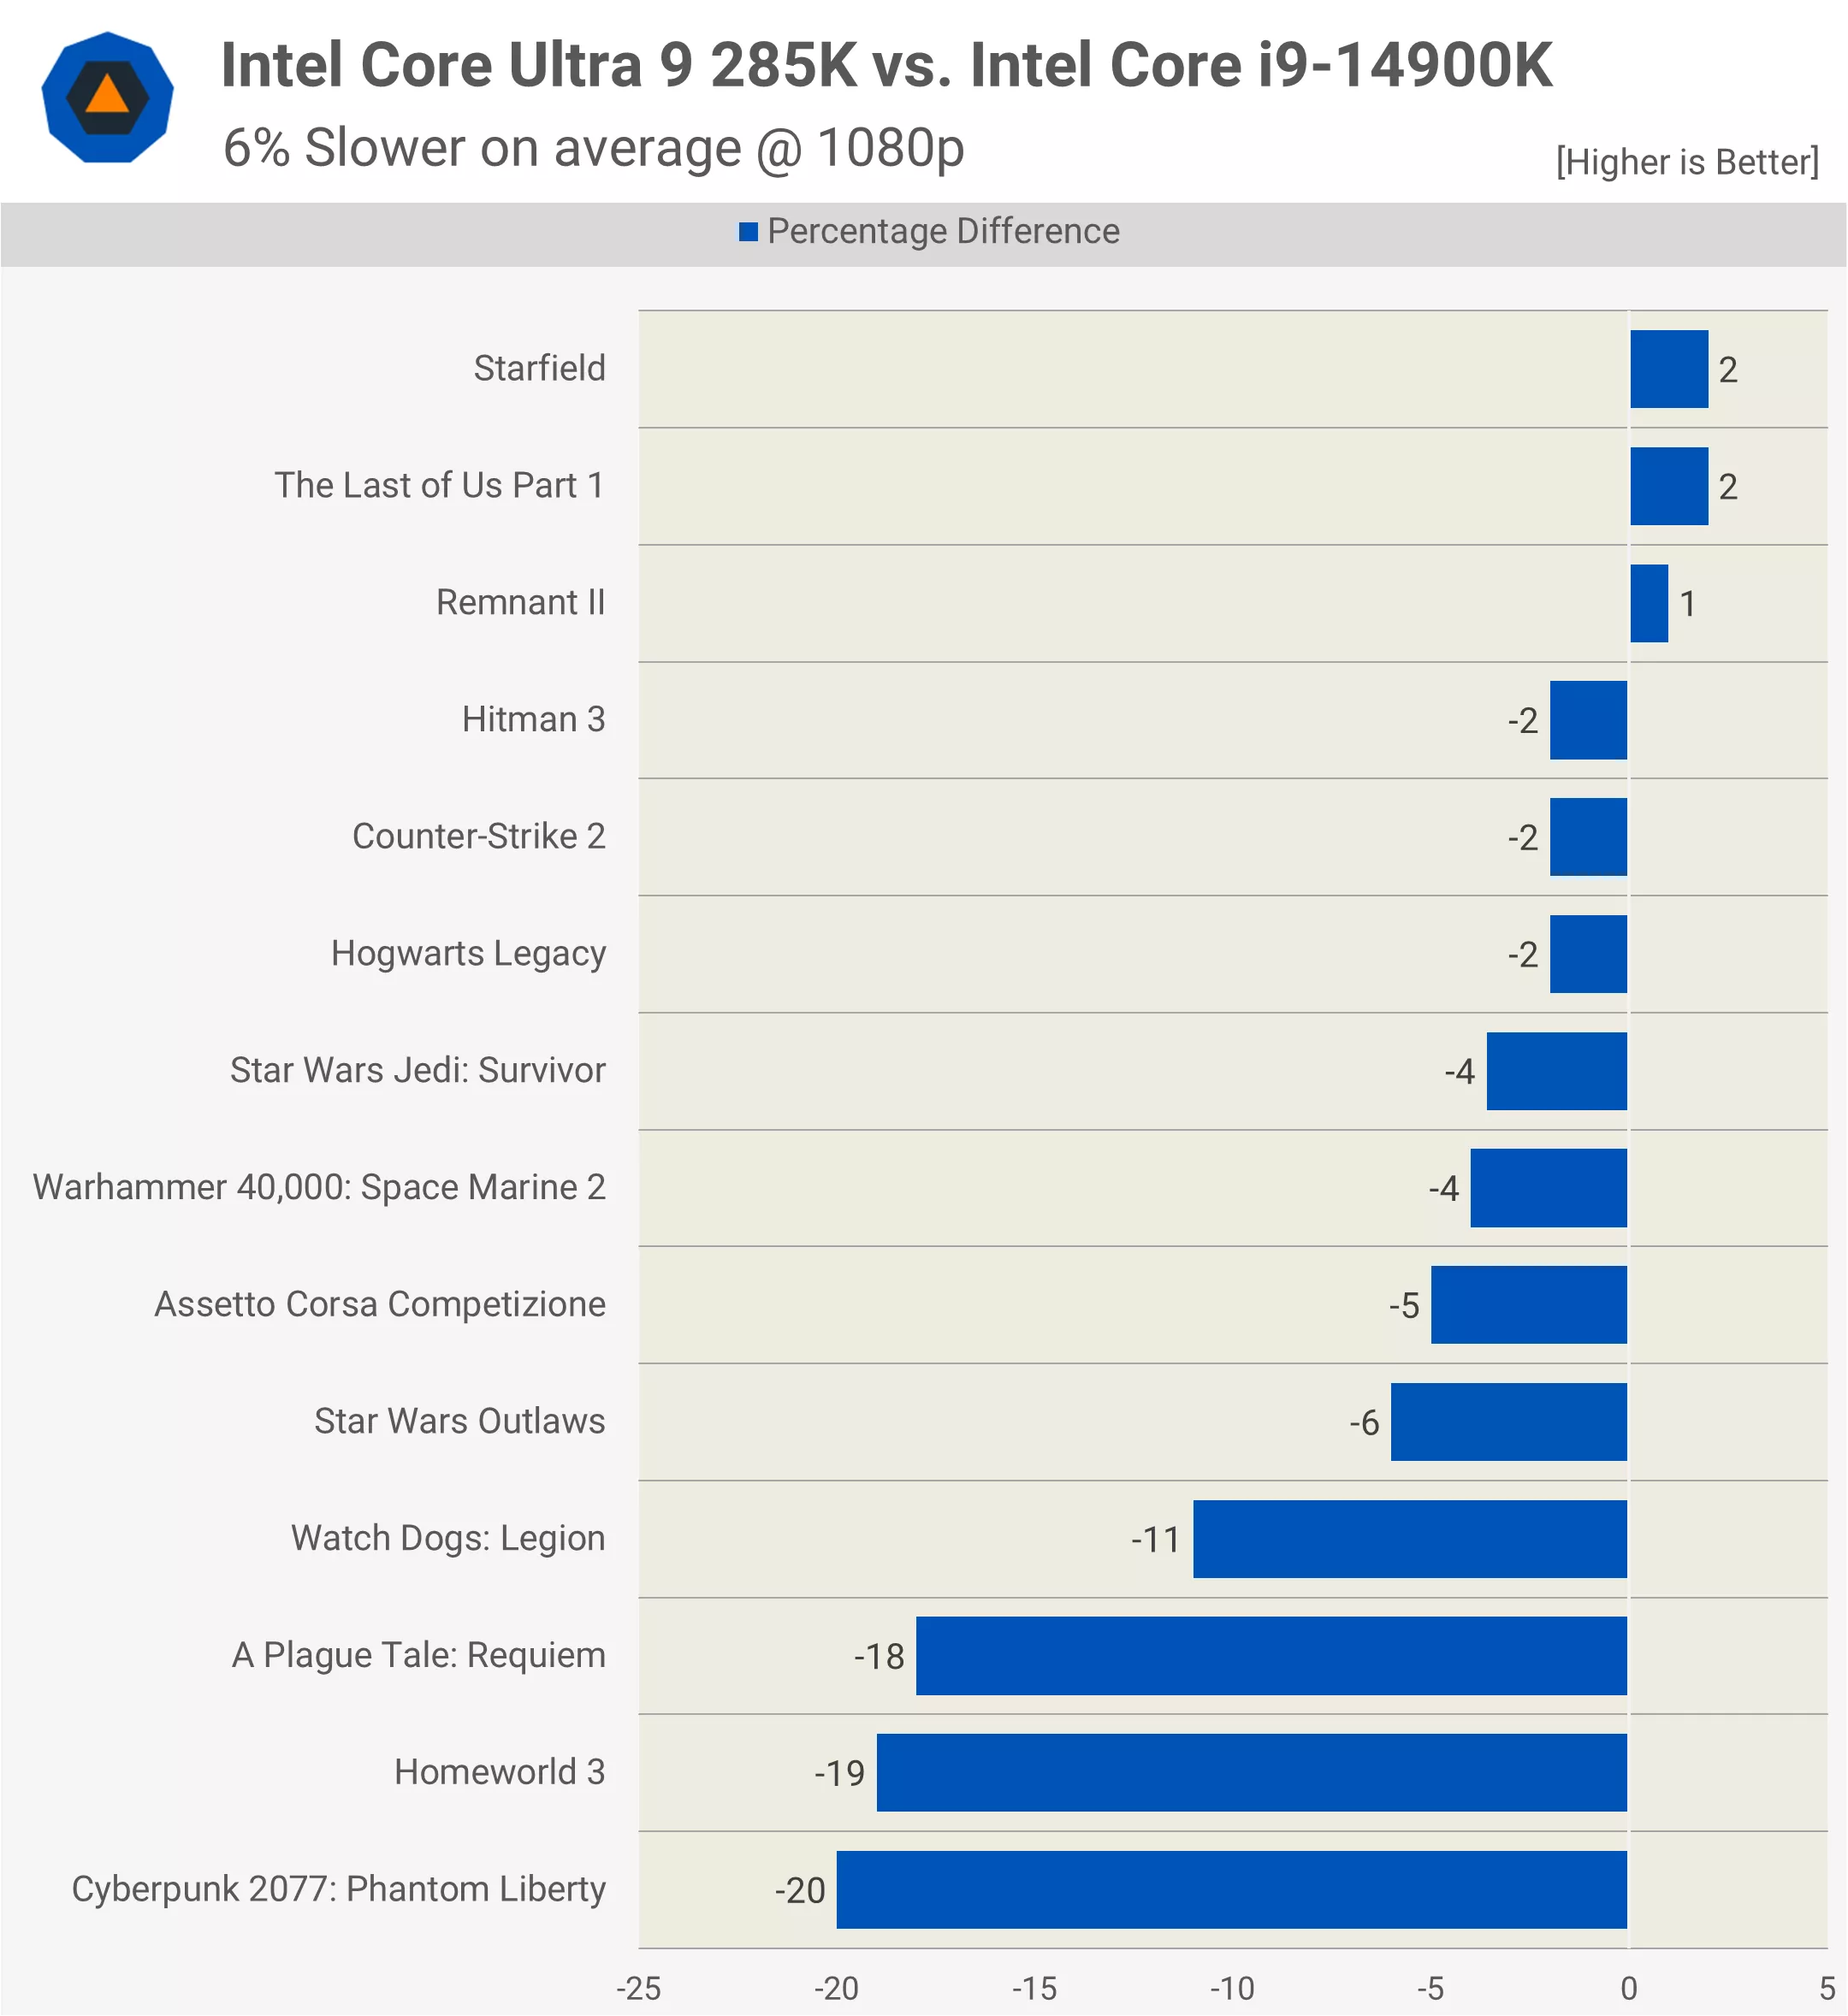
To recap, here’s how the 14900K and 285K compared, both using DDR5-7200 memory. On average, the 285K was 6% slower across the 14 games we tested, with significant losses in Watch Dogs: Legion, A Plague Tale: Requiem, Homeworld 3, and Cyberpunk 2077: Phantom Liberty.
Gaming Power Consumption
Arrow Lake makes significant strides in power efficiency, and while it’s much improved over the 14900K, the results still fall short when compared to Ryzen processors.
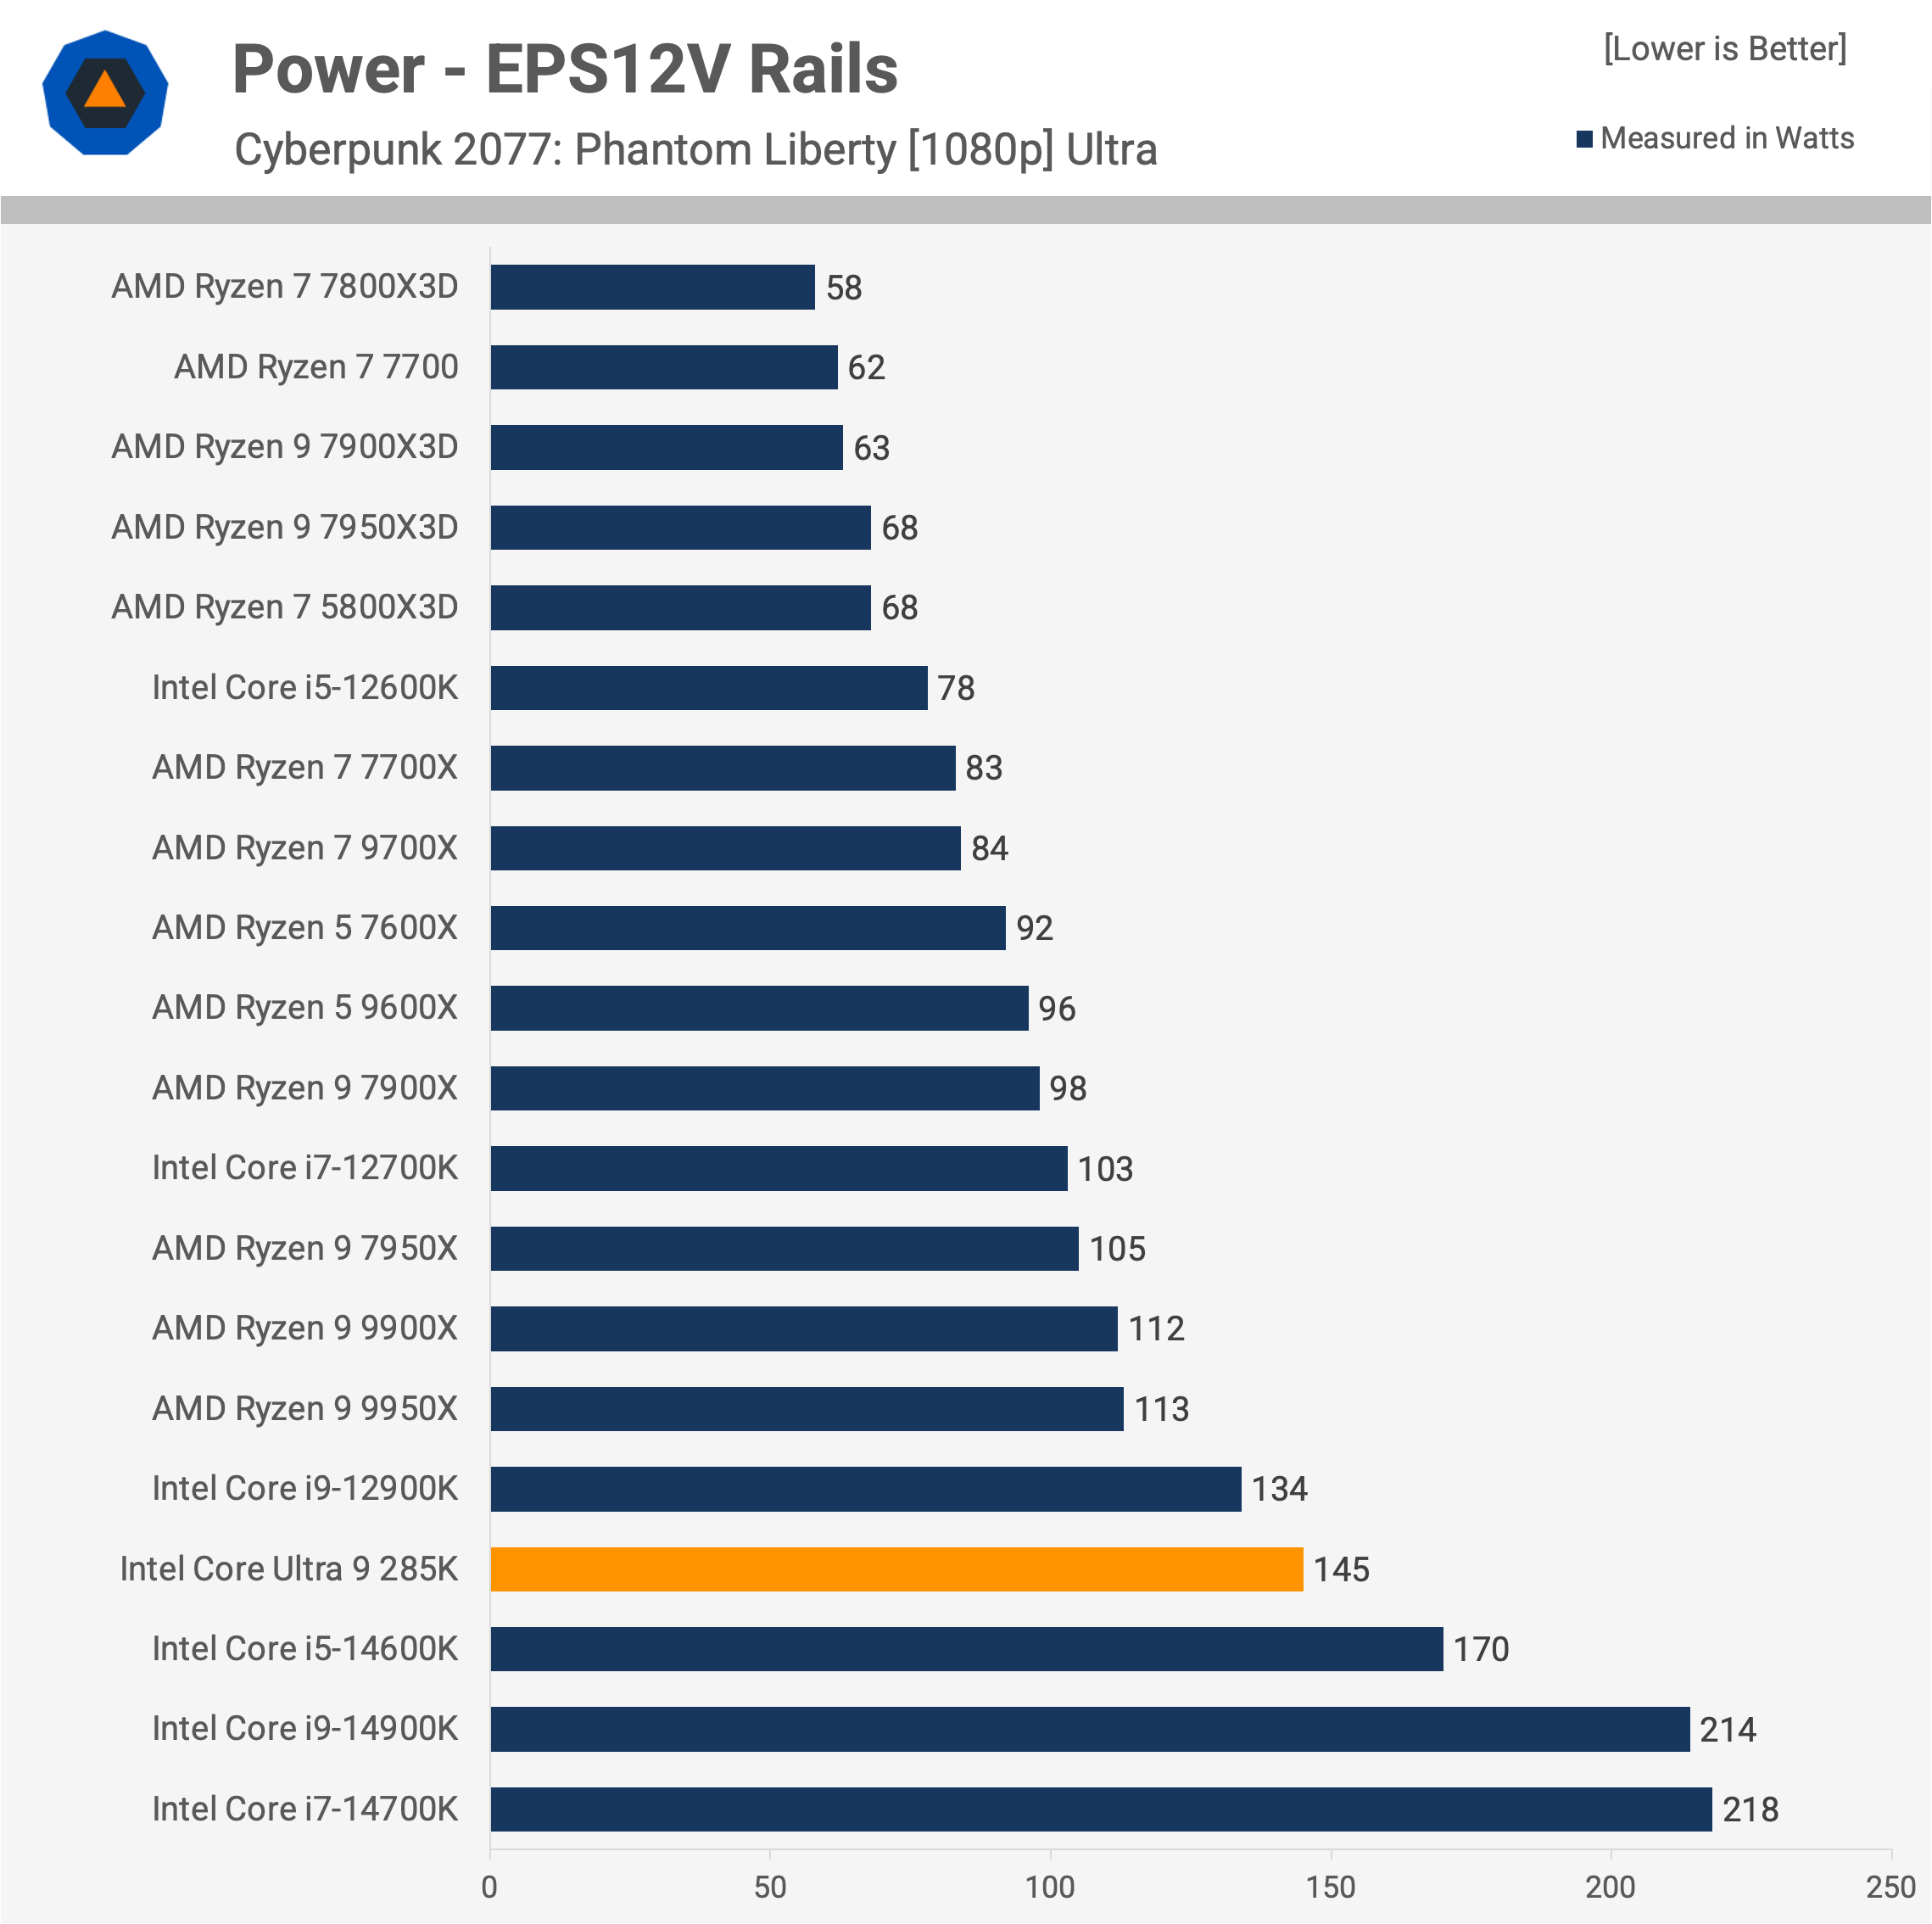
In our Cyberpunk testing, we observed a substantial 32% reduction in power usage for the 285K compared to the 14900K. However, it still consumed 28% more power than the 9950X, and performance for the 285K was poor in this title. Let’s now look at a game where the 285K performed better.
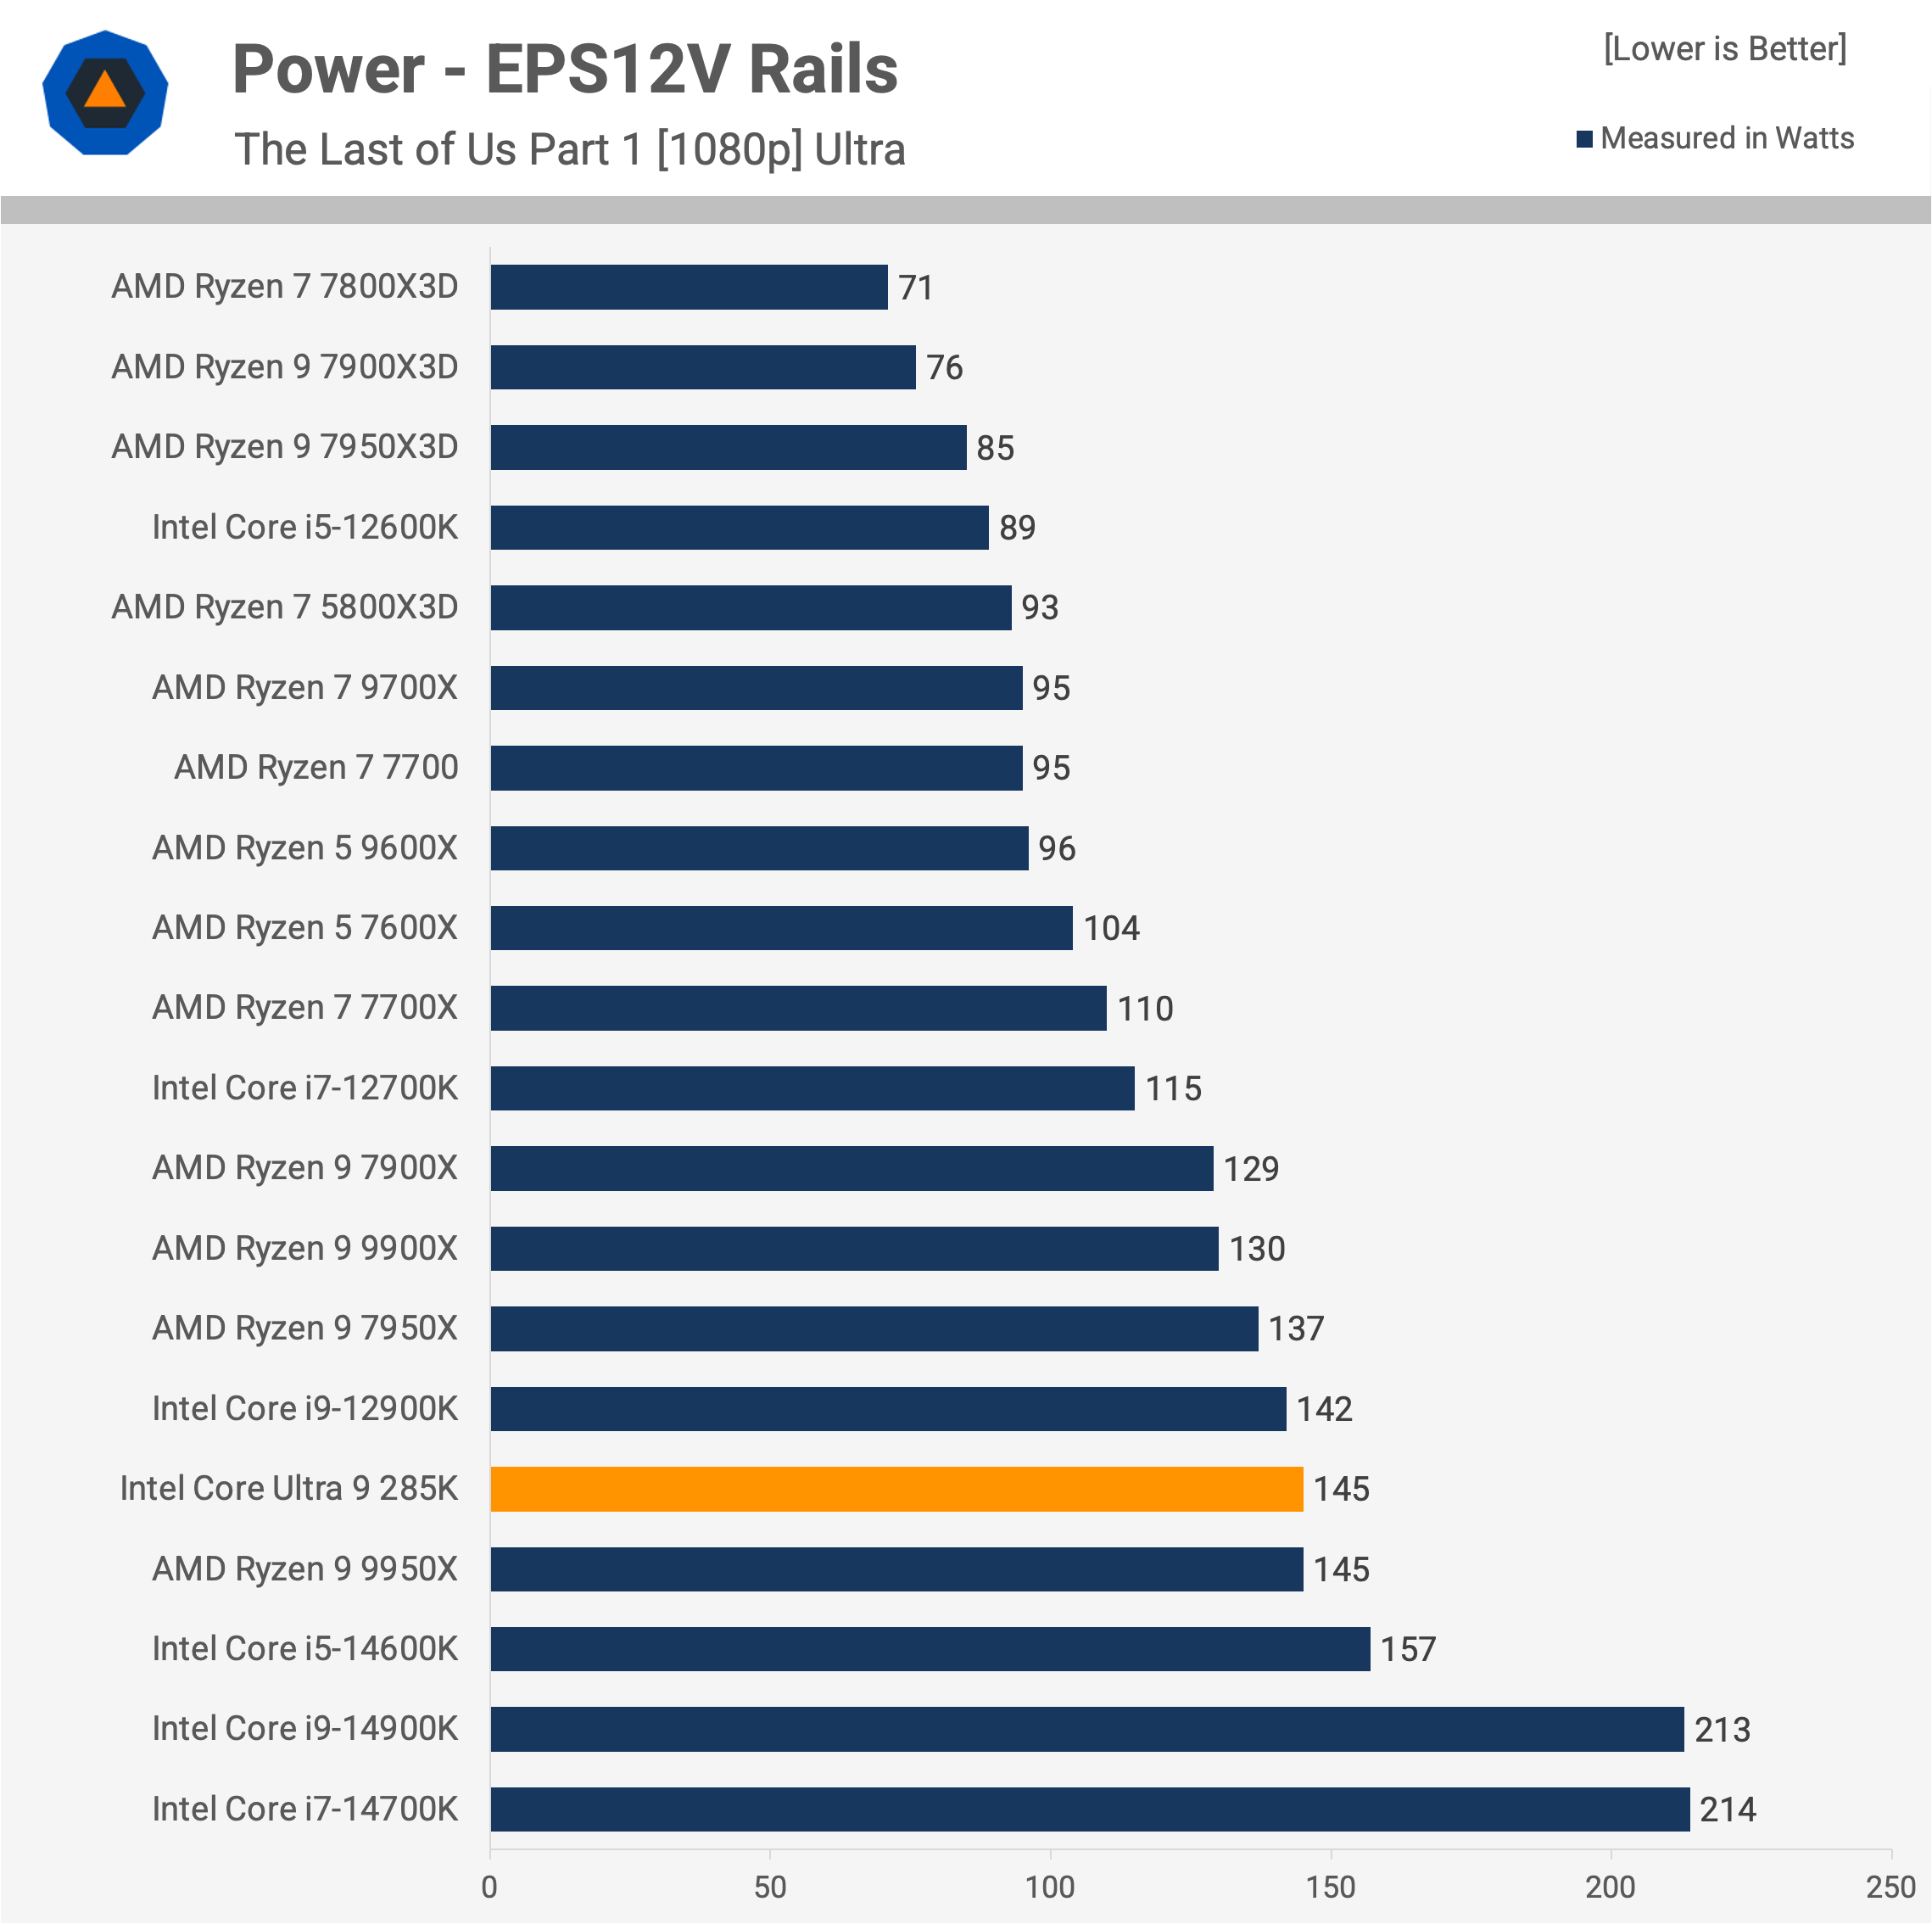
In The Last of Us Part 1, the 285K consumed 32% less power than the 14900K, which is impressive given it was a few percent faster. Unfortunately, when compared to the 7950X3D, the 285K used 71% more power for the same level of performance, which is disappointing. While Intel has made improvements in power efficiency, reducing power consumption by almost 70W from the 14900K, it still lags behind AMD, especially at the current performance levels.
14 Game Average
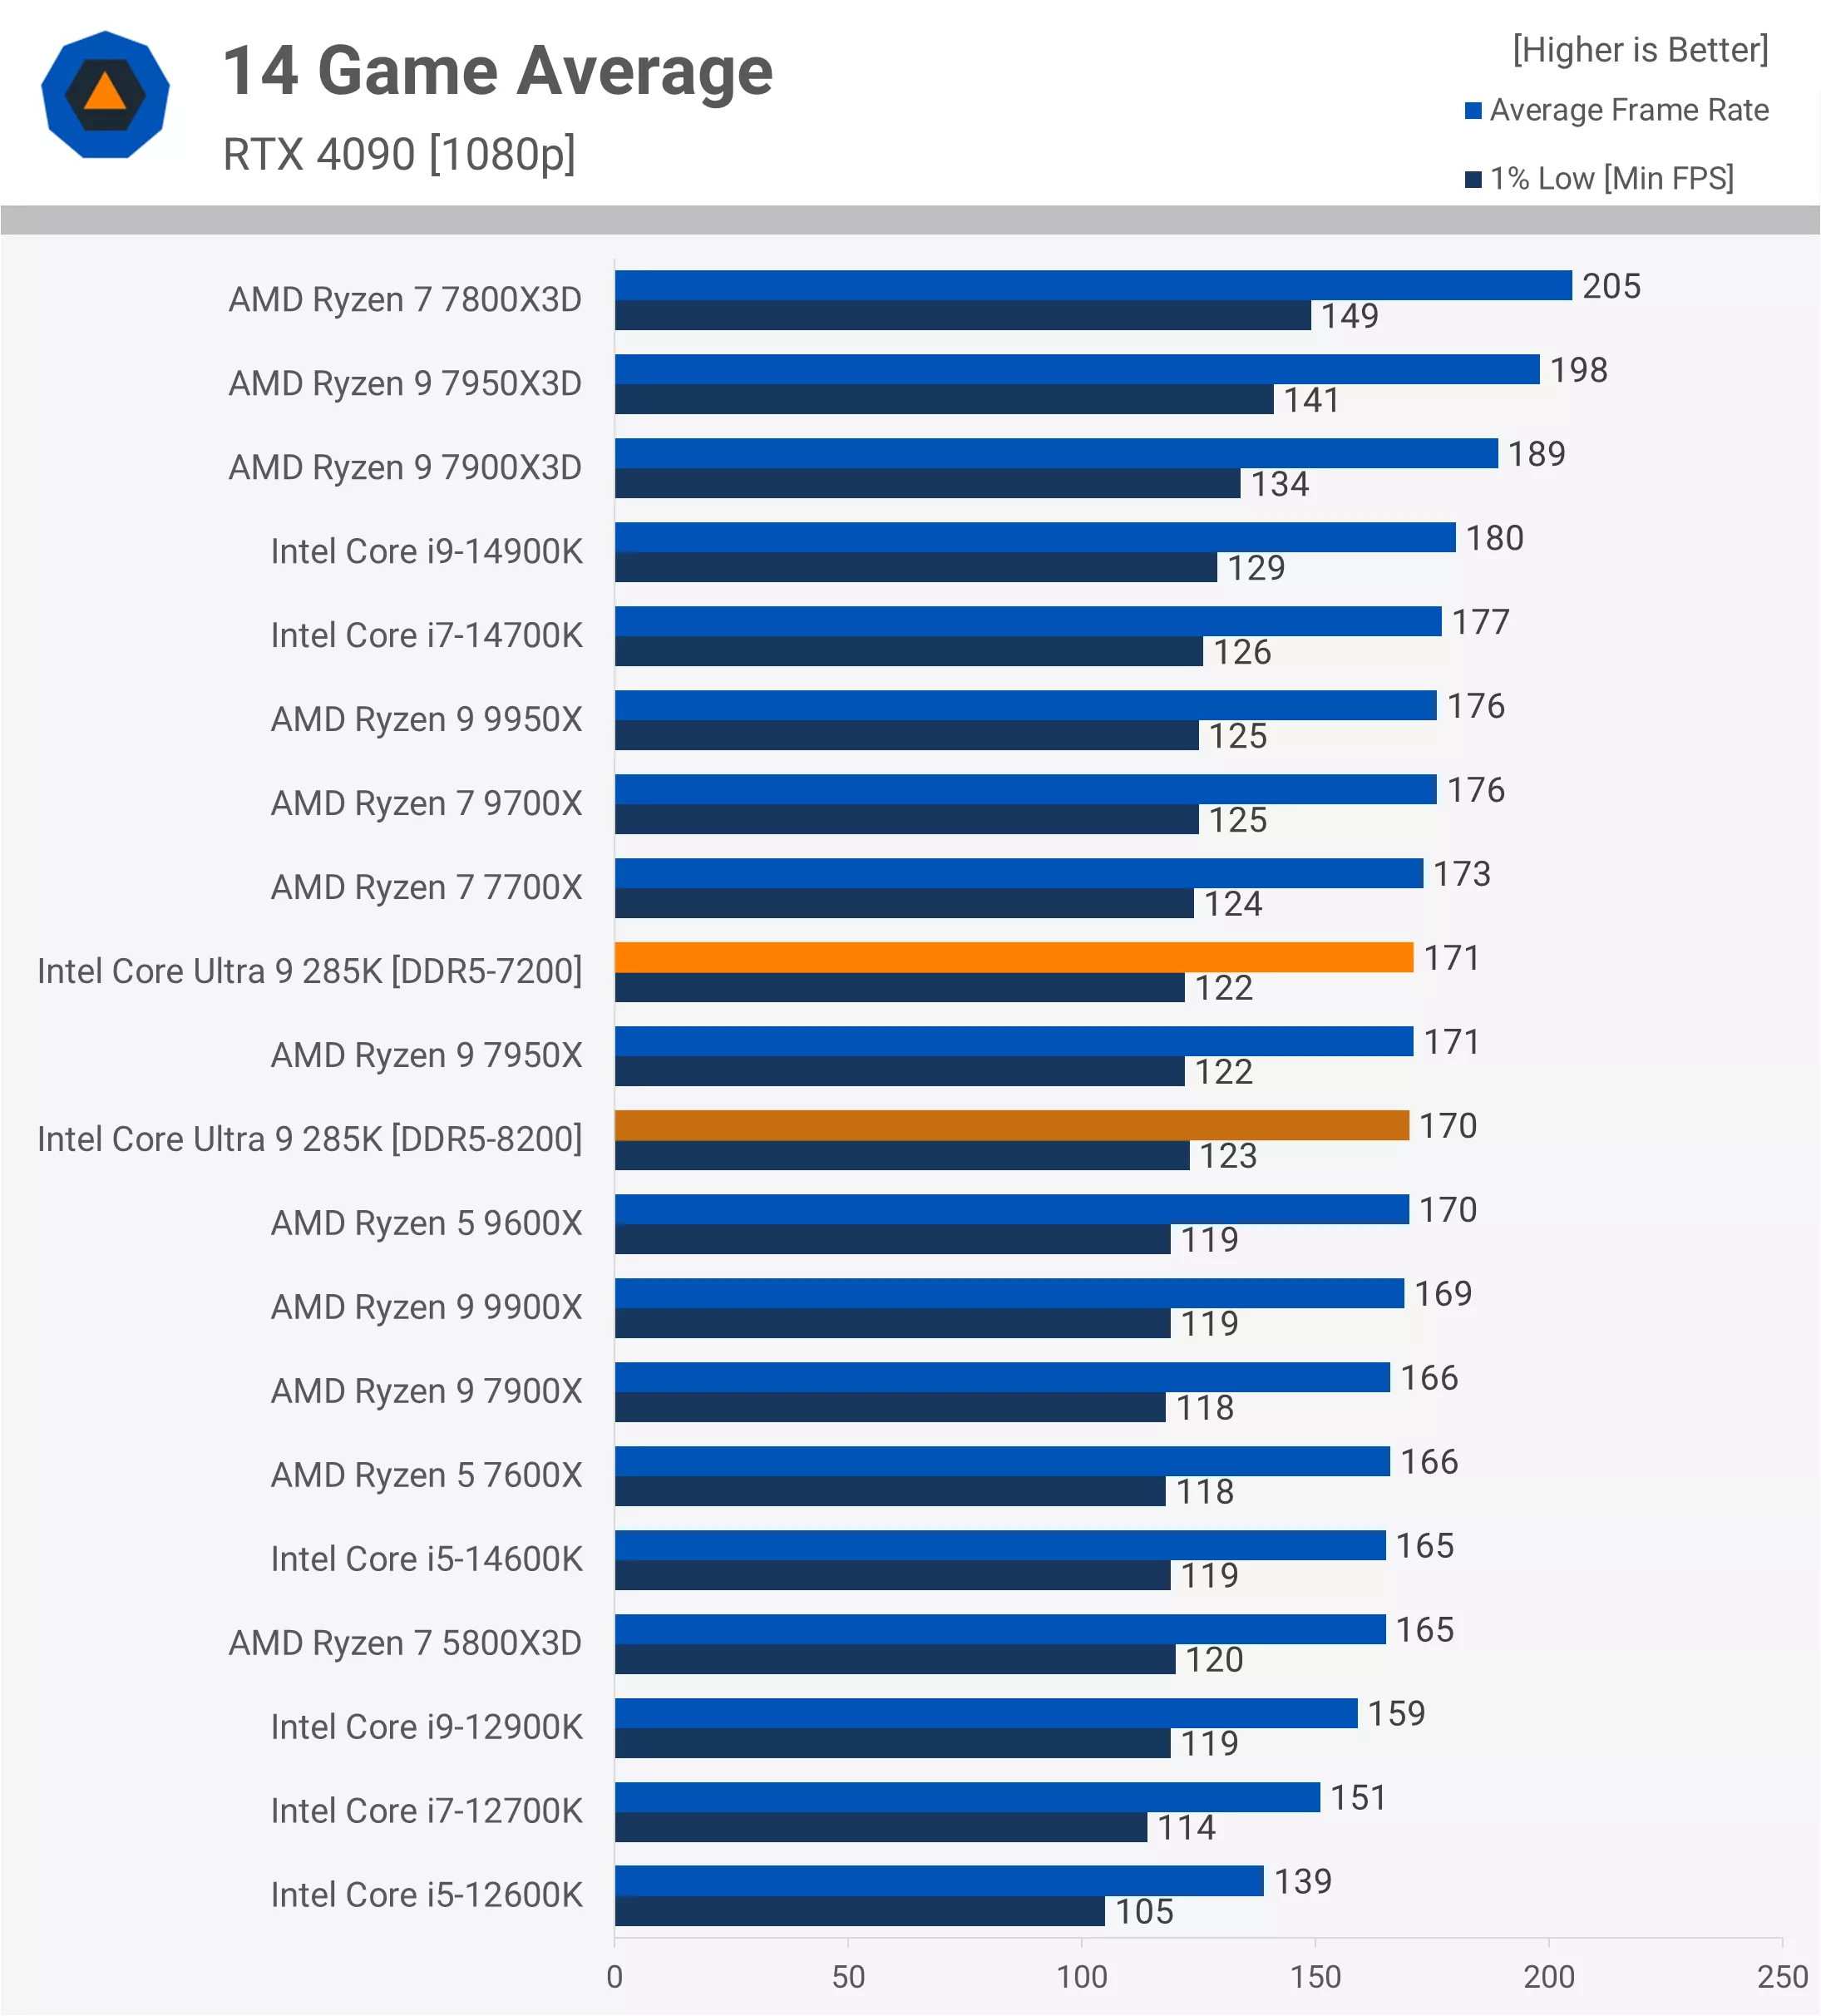
Looking at the 14-game average, we see that the 285K is 5% slower than the 14900K, when calculating using the geometric mean. This means that, on average, it’s slightly slower than the 7700X and about on par with the 9600X, which is quite surprising. It’s also 14% slower than the 7950X3D.
Here, we see just how much Ryzen processors have benefited from the 24H2 update, with the 7800X3D being 14% faster than the 14900K, which is remarkable. Of course, we are now power-limiting the Core i9, but even so, that margin is impressive.
Cost Per Frame
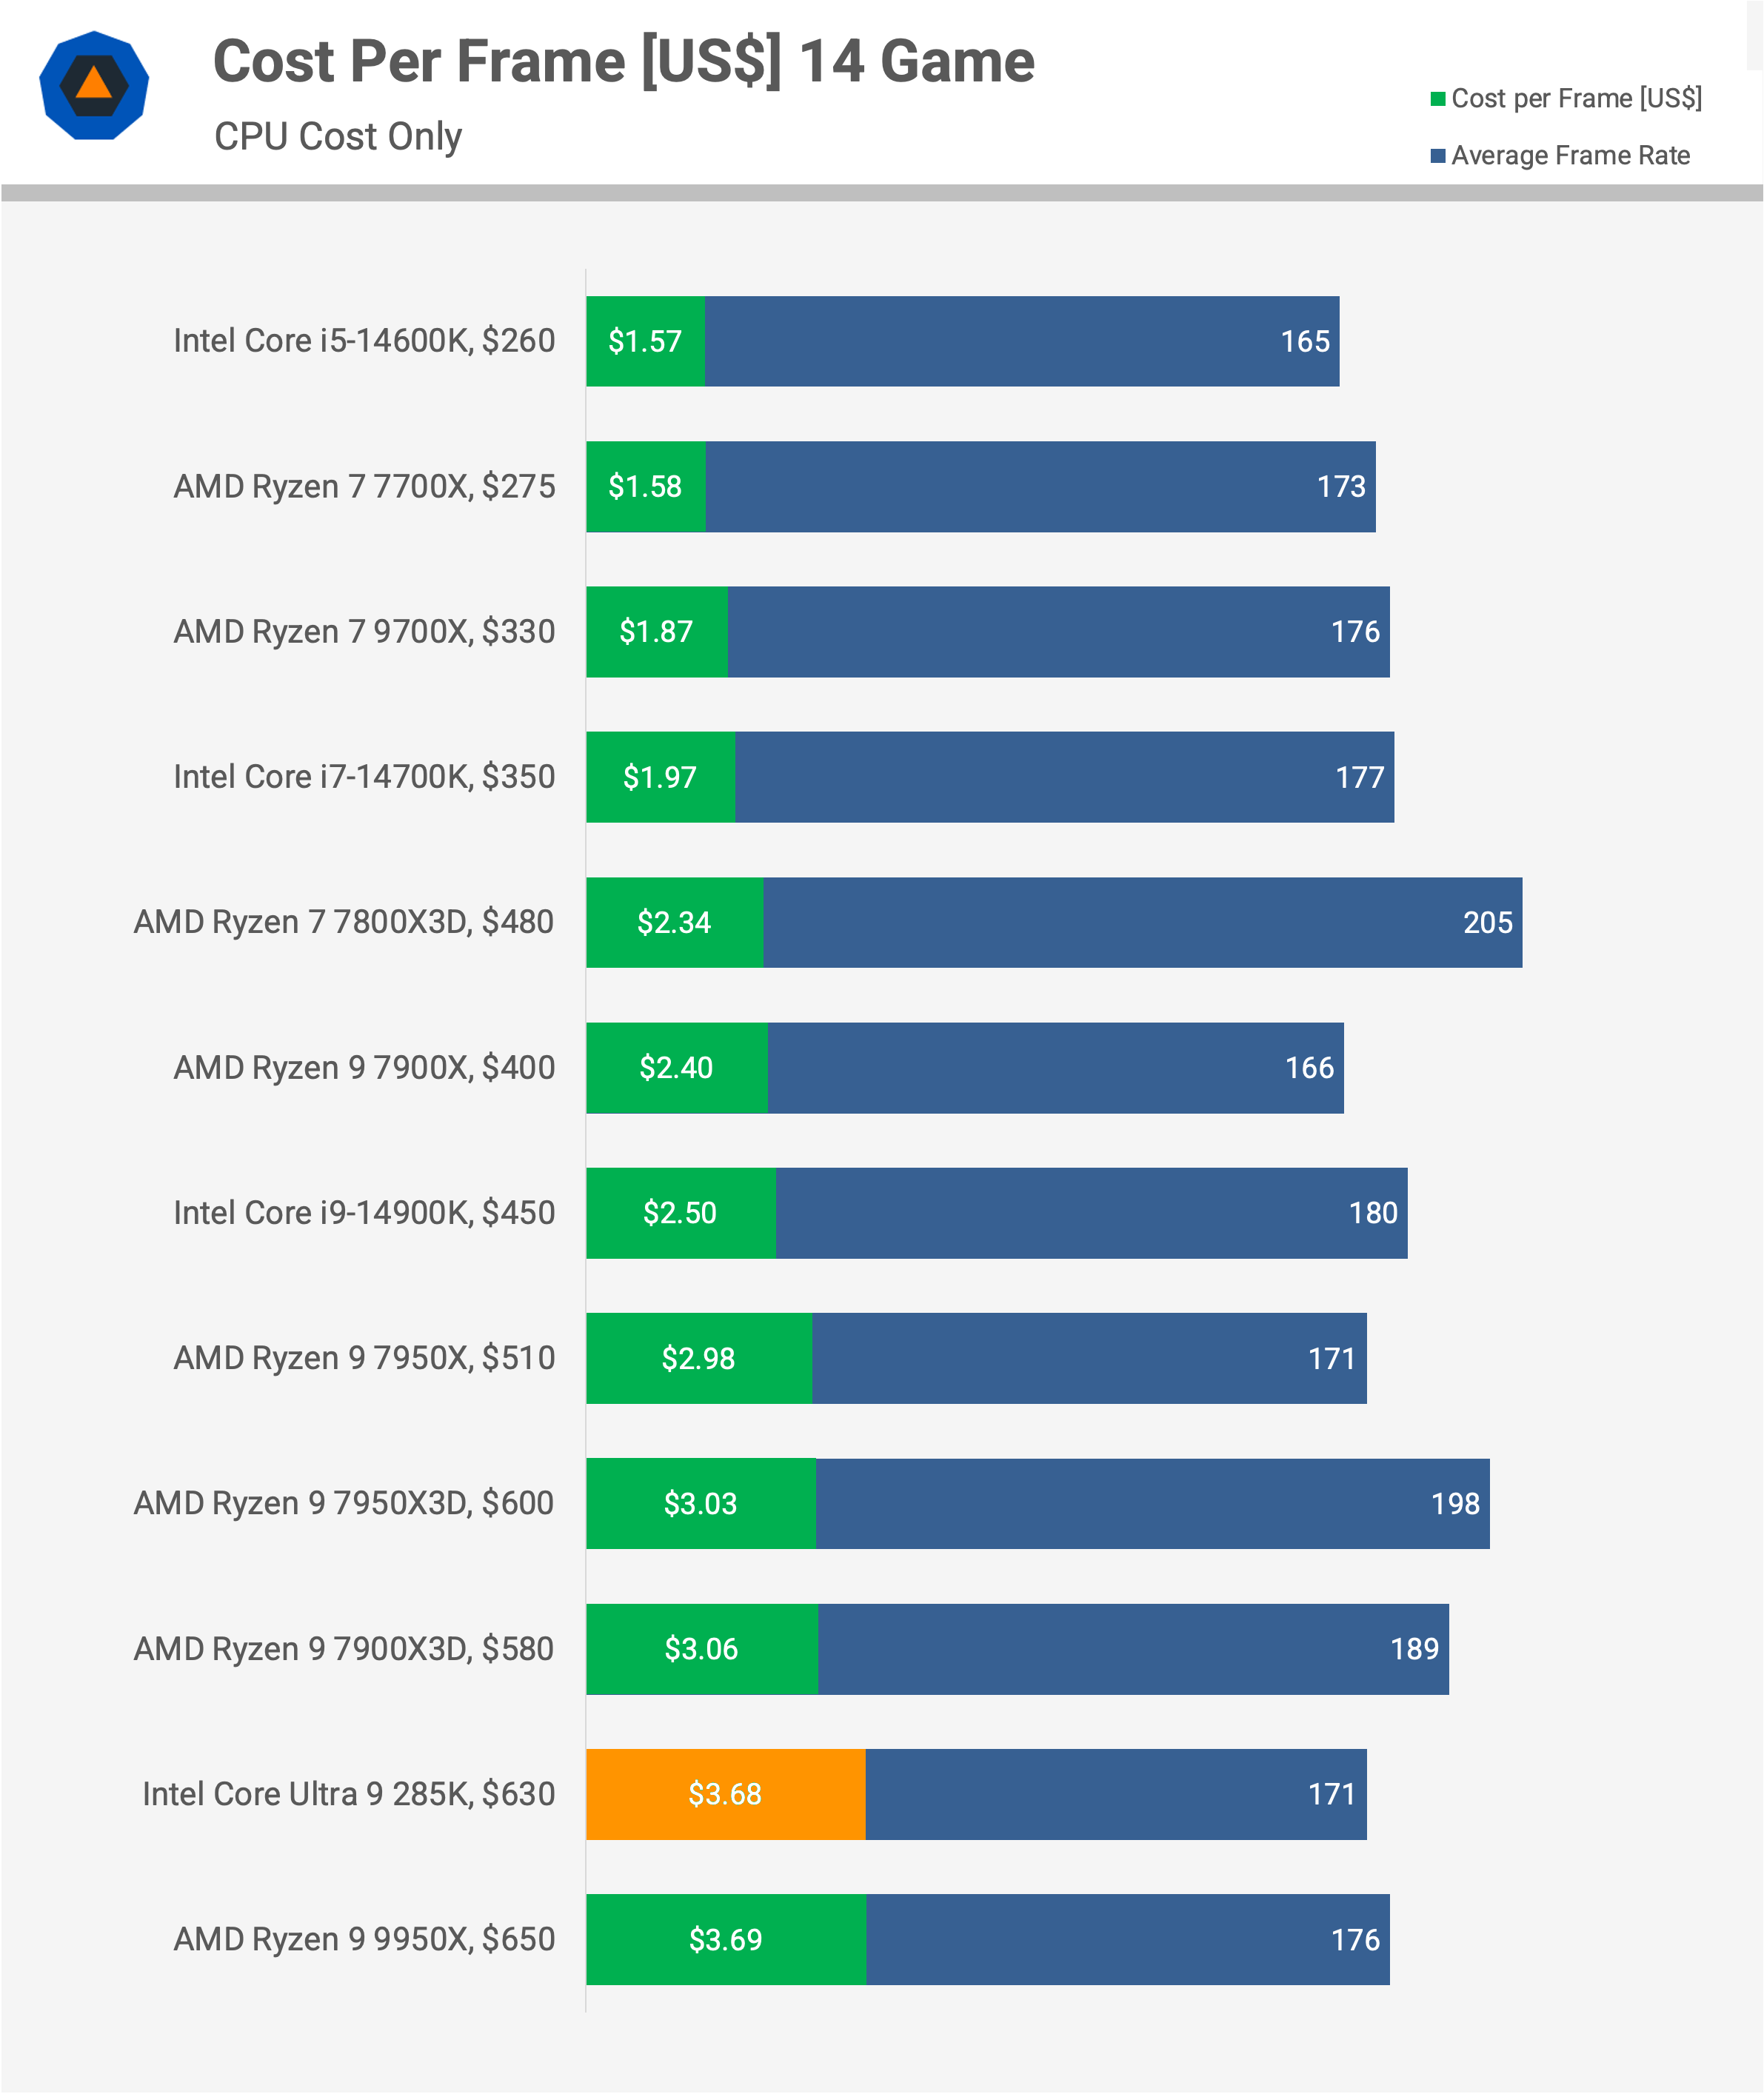
Typically, our cost-per-frame analysis for CPUs includes the cost of the motherboard and memory, but in this case, the prices for those components are quite similar. While this may reduce the overall margins slightly, the picture is clear: the 285K offers poor value for gamers.
It provides similar value to the 9950X, making it much worse than the 7950X3D, which is probably the best all-rounder at the moment. It also performs worse than the outgoing 14900K, which we have never recommended.
Interestingly, the 7800X3D, which has sold for as little as $340 this year, still offers far better value at $480. Even with recent price increases, the 7800X3D remains a strong contender in terms of value.
Windows 24H2 Gaming Performance
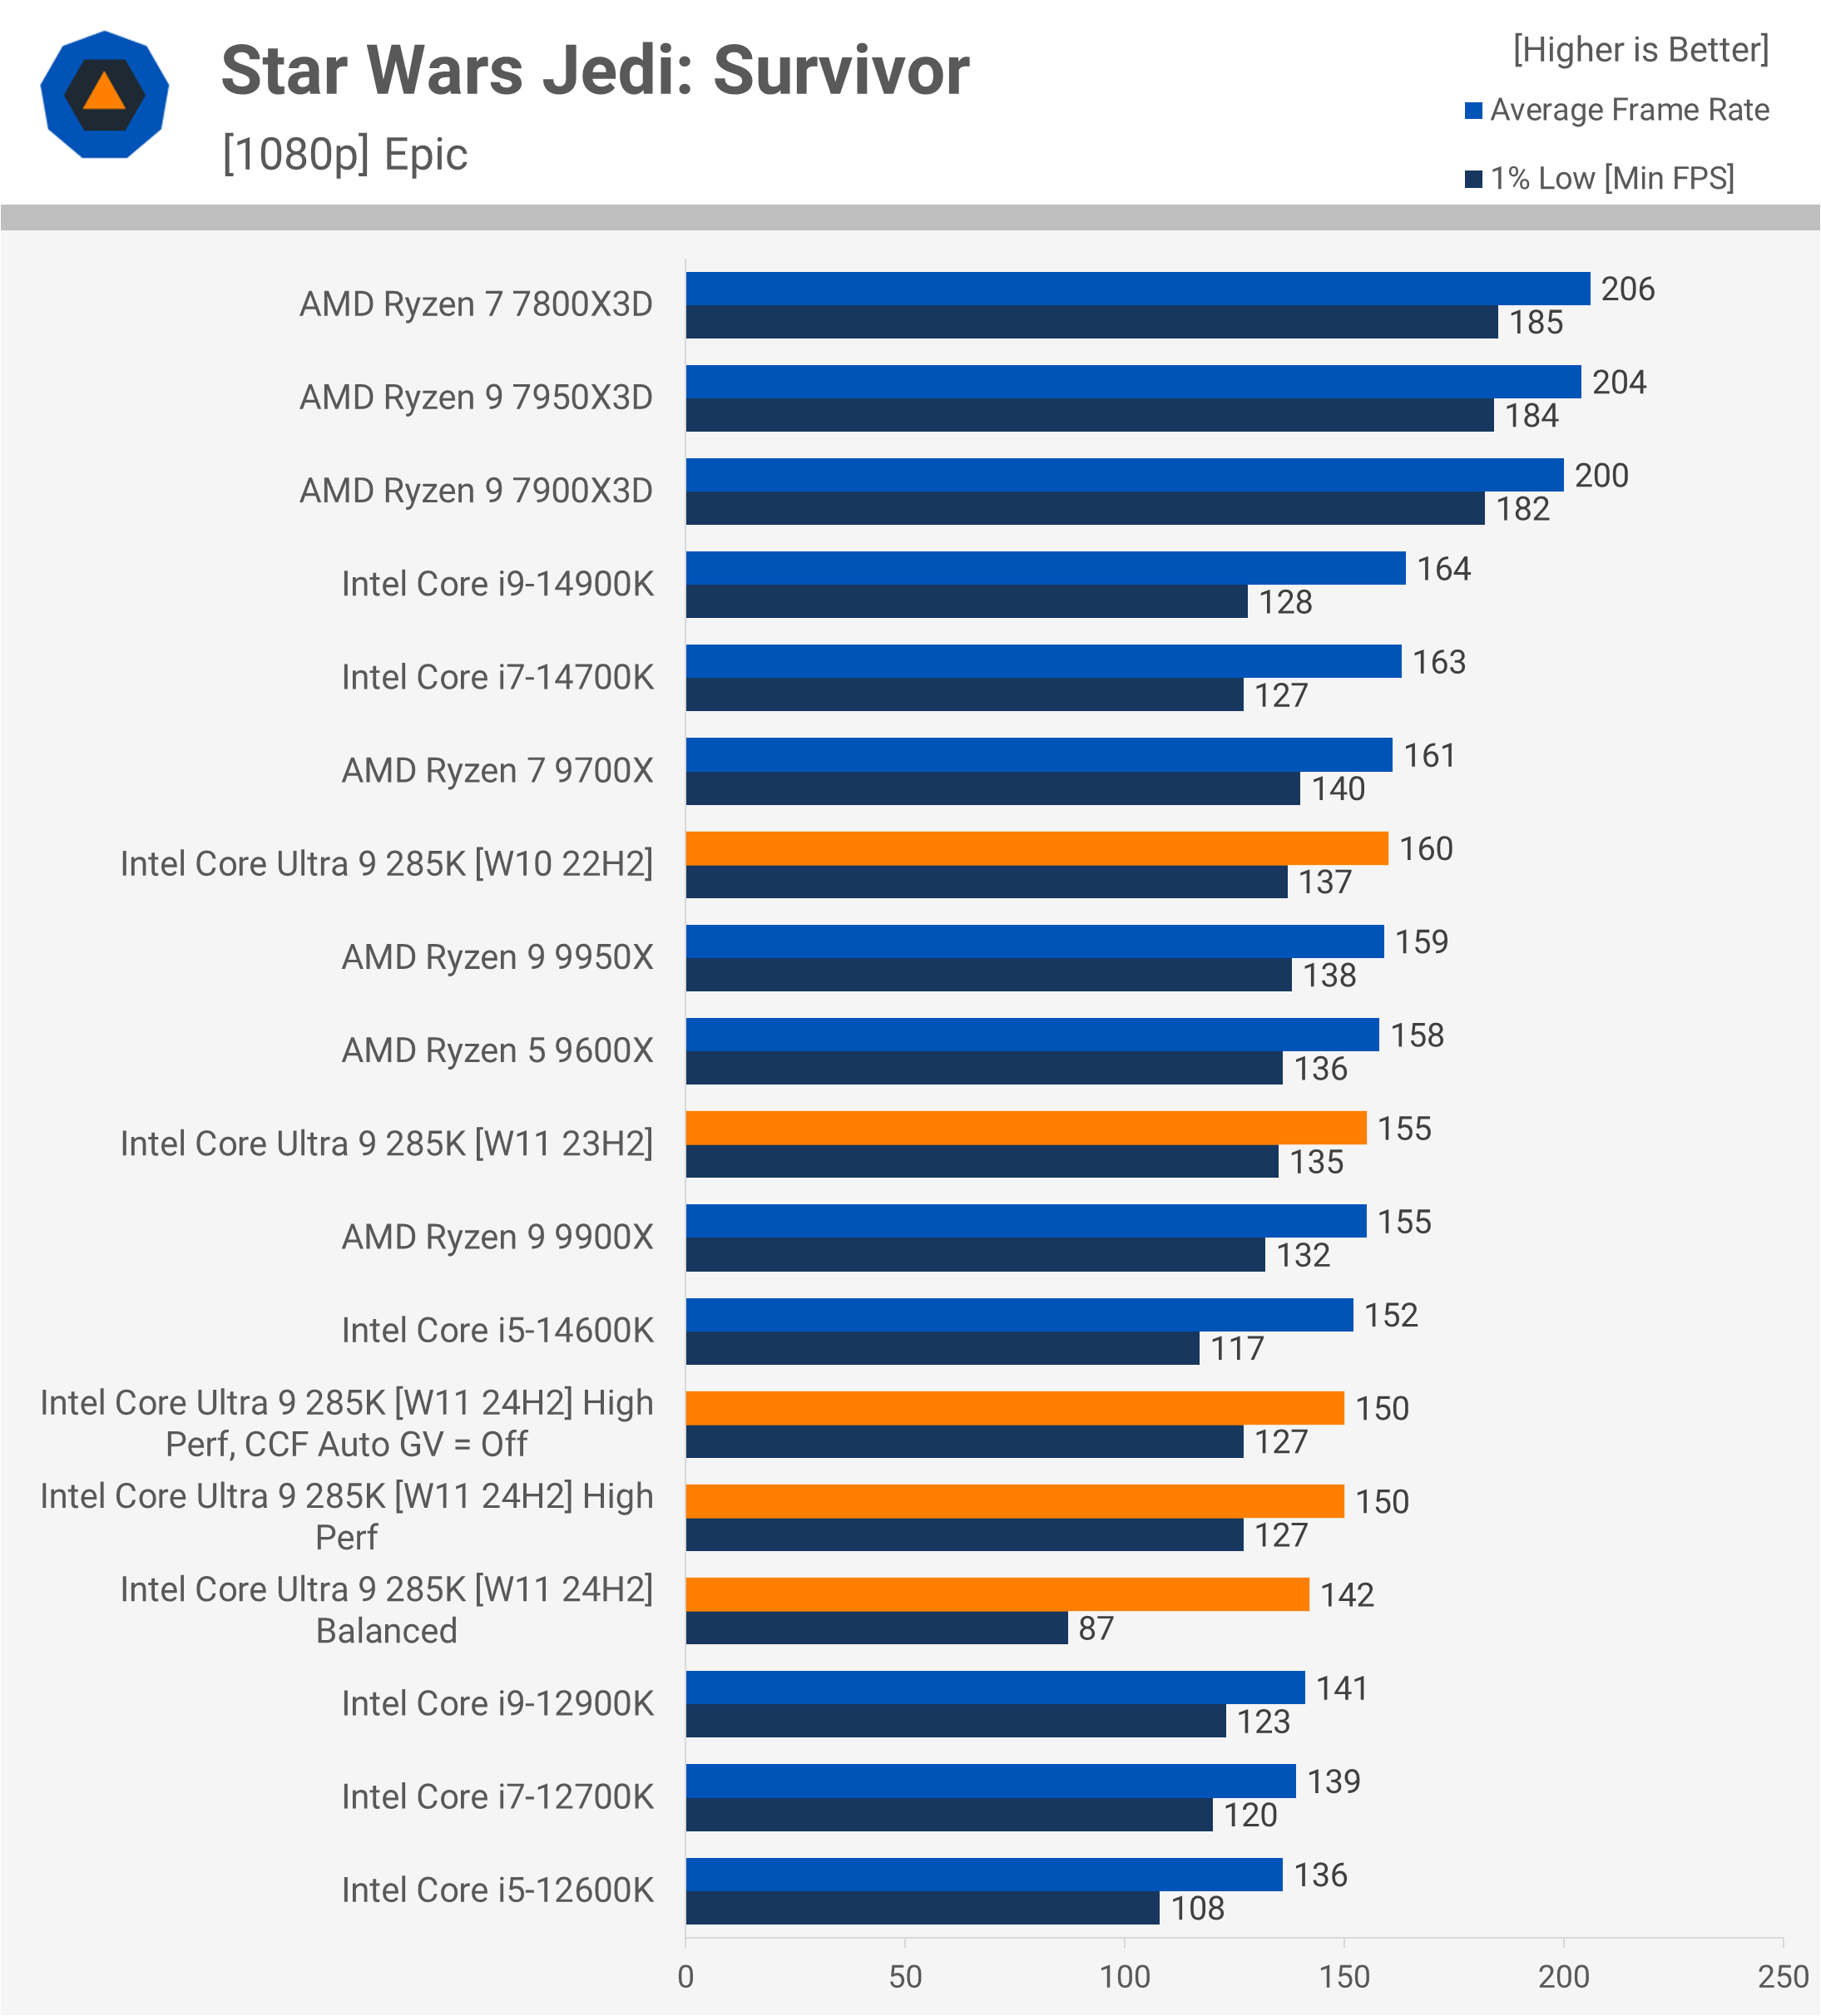
As mentioned earlier, Arrow Lake’s gaming performance was even worse on Windows 11 24H2. Intel is aware of this issue and has suggested enabling the ‘high performance’ or ‘high power’ profile in Windows for optimal performance on 24H2. They also speculated that there might be an issue with the ring bus clock on 24H2, suggesting a BIOS change by disabling the ‘CCF Auto GV’ setting.
We explored these suggestions using a limited set of gaming benchmarks to see the impact. Additionally, we included a fresh install of Windows 10, as many users still rely on this OS and may be curious about the 285K’s performance on it.
Star Wars Jedi: Survivor
Looking at the 23H2 data, the 285K’s performance improved by 3% when using Windows 10, which is a good sign. However, it’s likely that parts like the 14900K would see a similar or possibly greater performance uplift.
Using the default 24H2 configuration with the balanced power profile severely hindered the 285K, reducing the average frame rate by 8% compared to 23H2, with the 1% lows dropping by 36%. Clearly, something is wrong here. Switching to the ‘high performance’ power plan improved the frame rate to 150 fps on average, though still below what we saw with 23H2, but a notable improvement nonetheless.
Cyberpunk 2077: Phantom Liberty
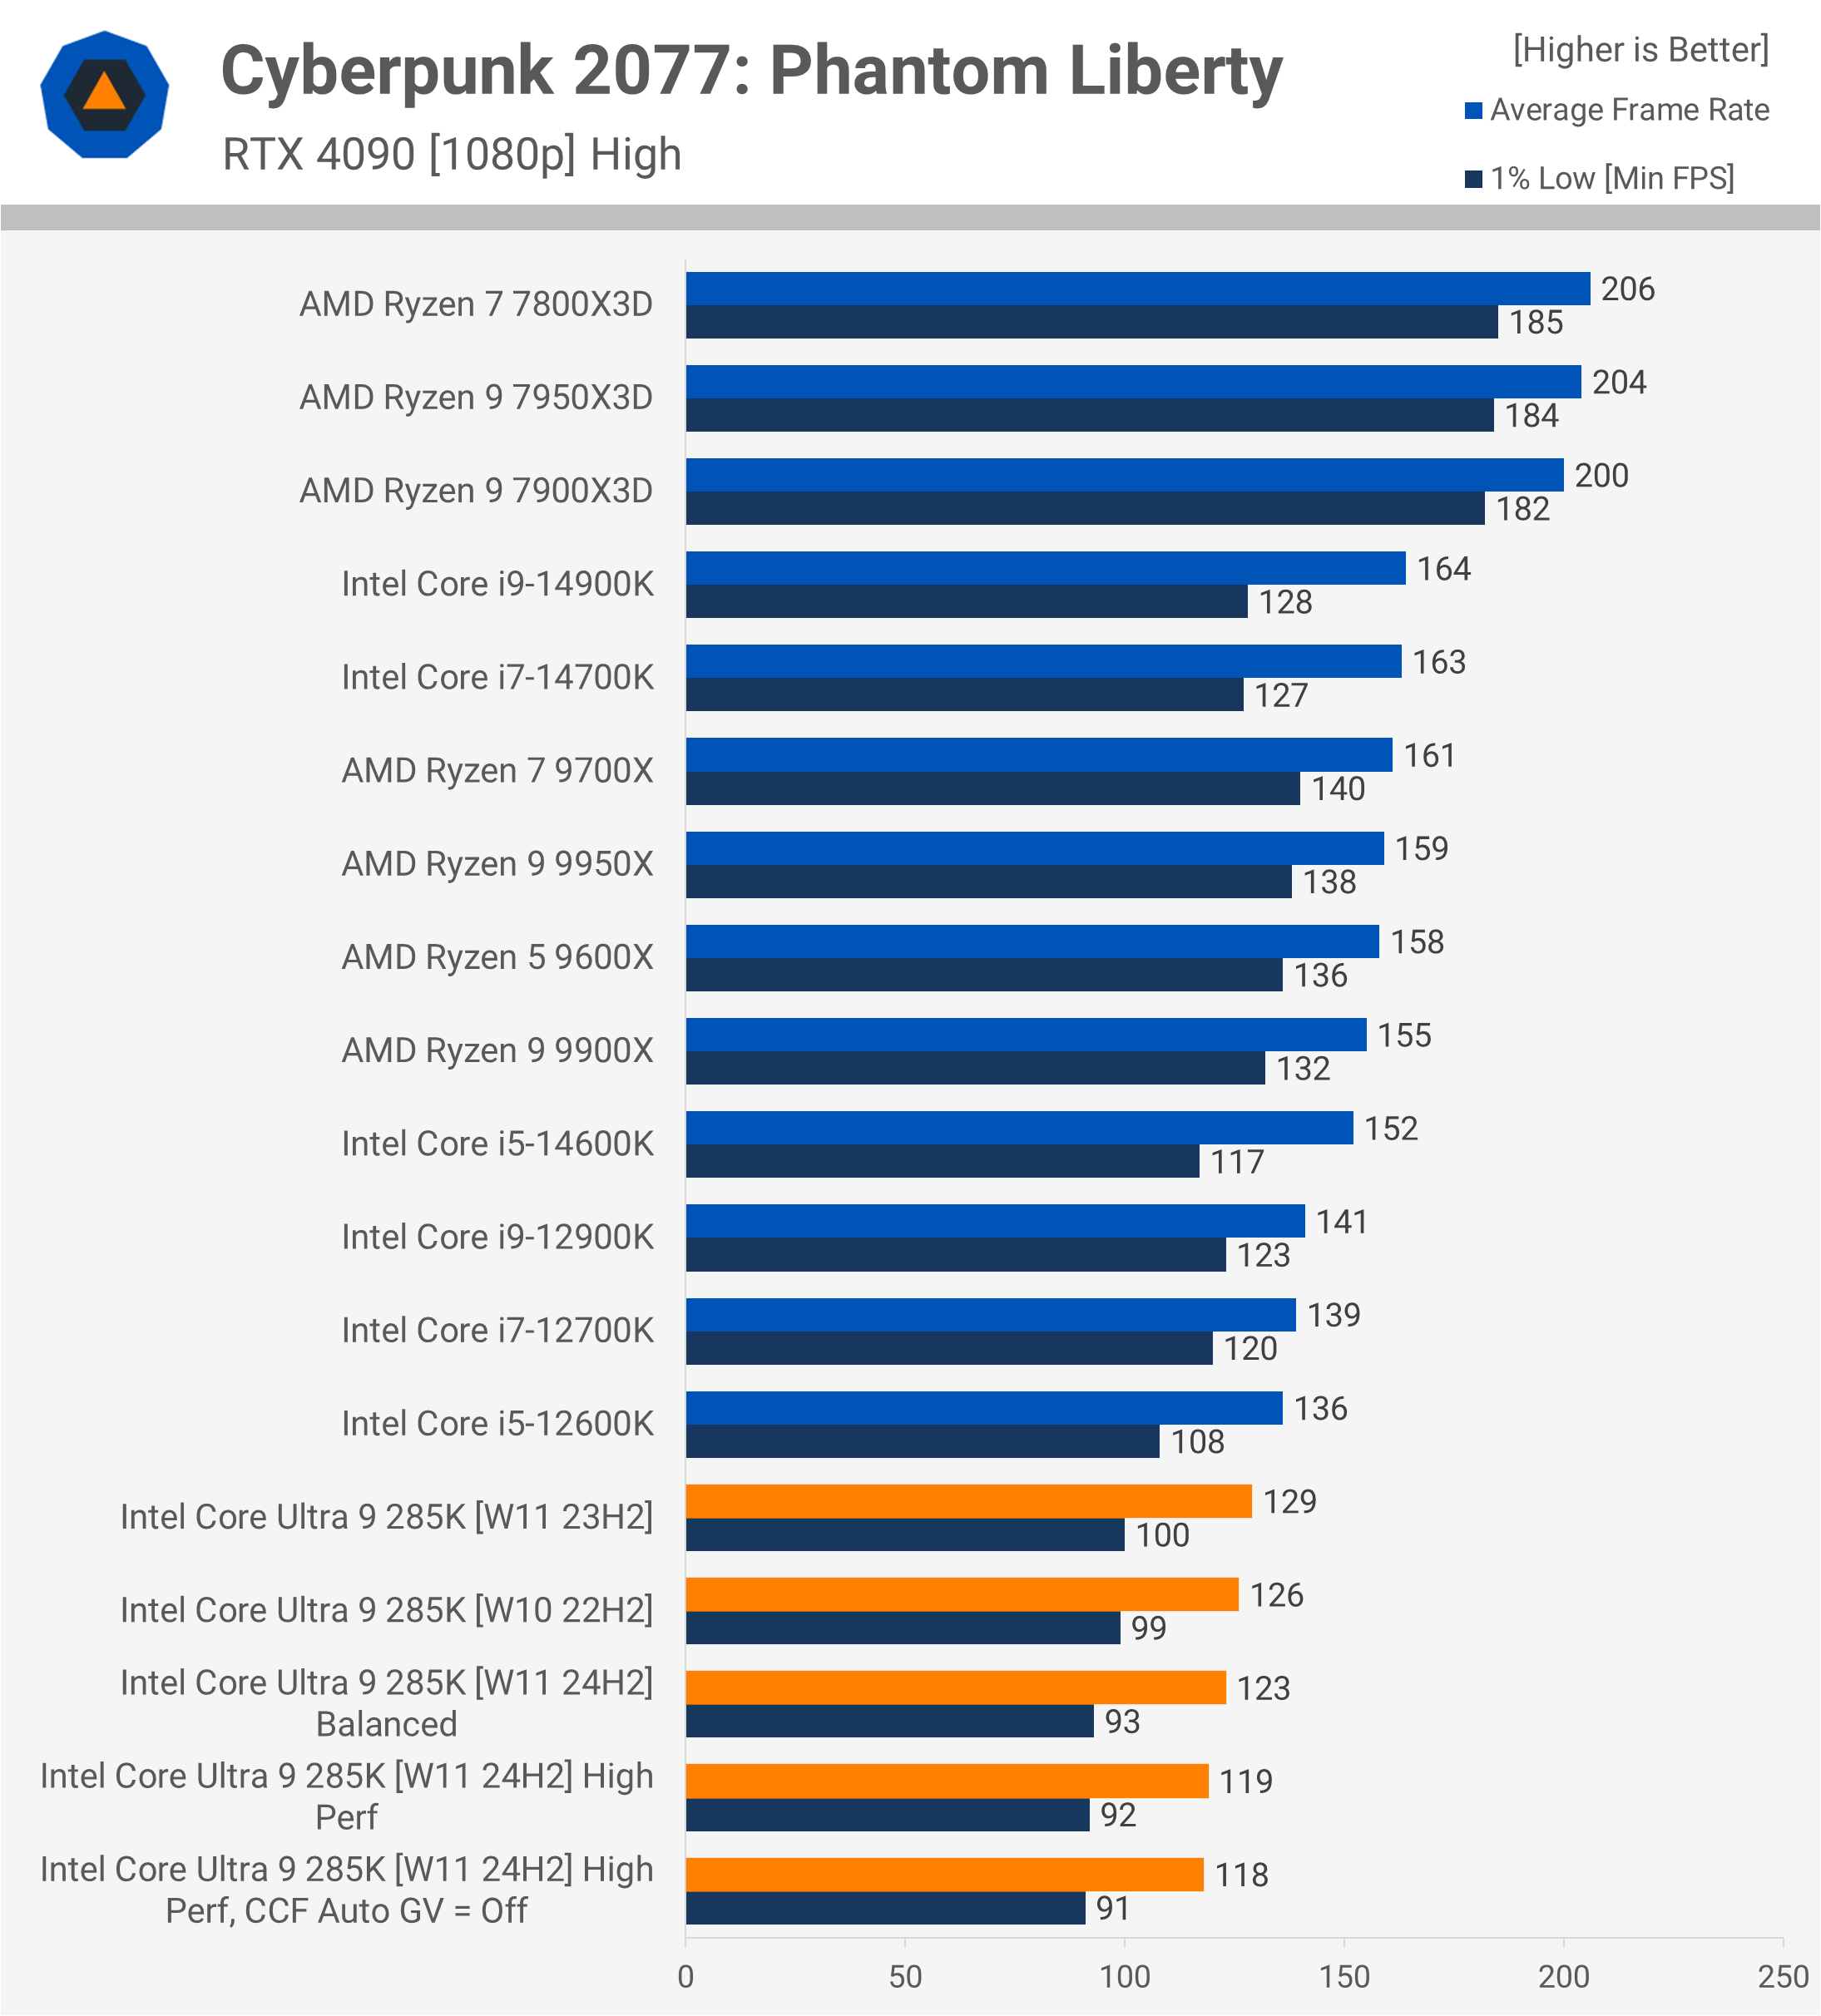
In Cyberpunk 2077: Phantom Liberty, the 285K performed best using 23H2, with a slight frame drop when using Windows 10, though the difference was within the margin of error.
Interestingly, the 24H2 balanced power plan performed better here, as the frame rate regressed by 3% when switching to the high performance profile. Adjusting the ‘CCF Auto GV’ setting had no impact, similar to what we saw in Star Wars Jedi: Survivor.
Homeworld 3
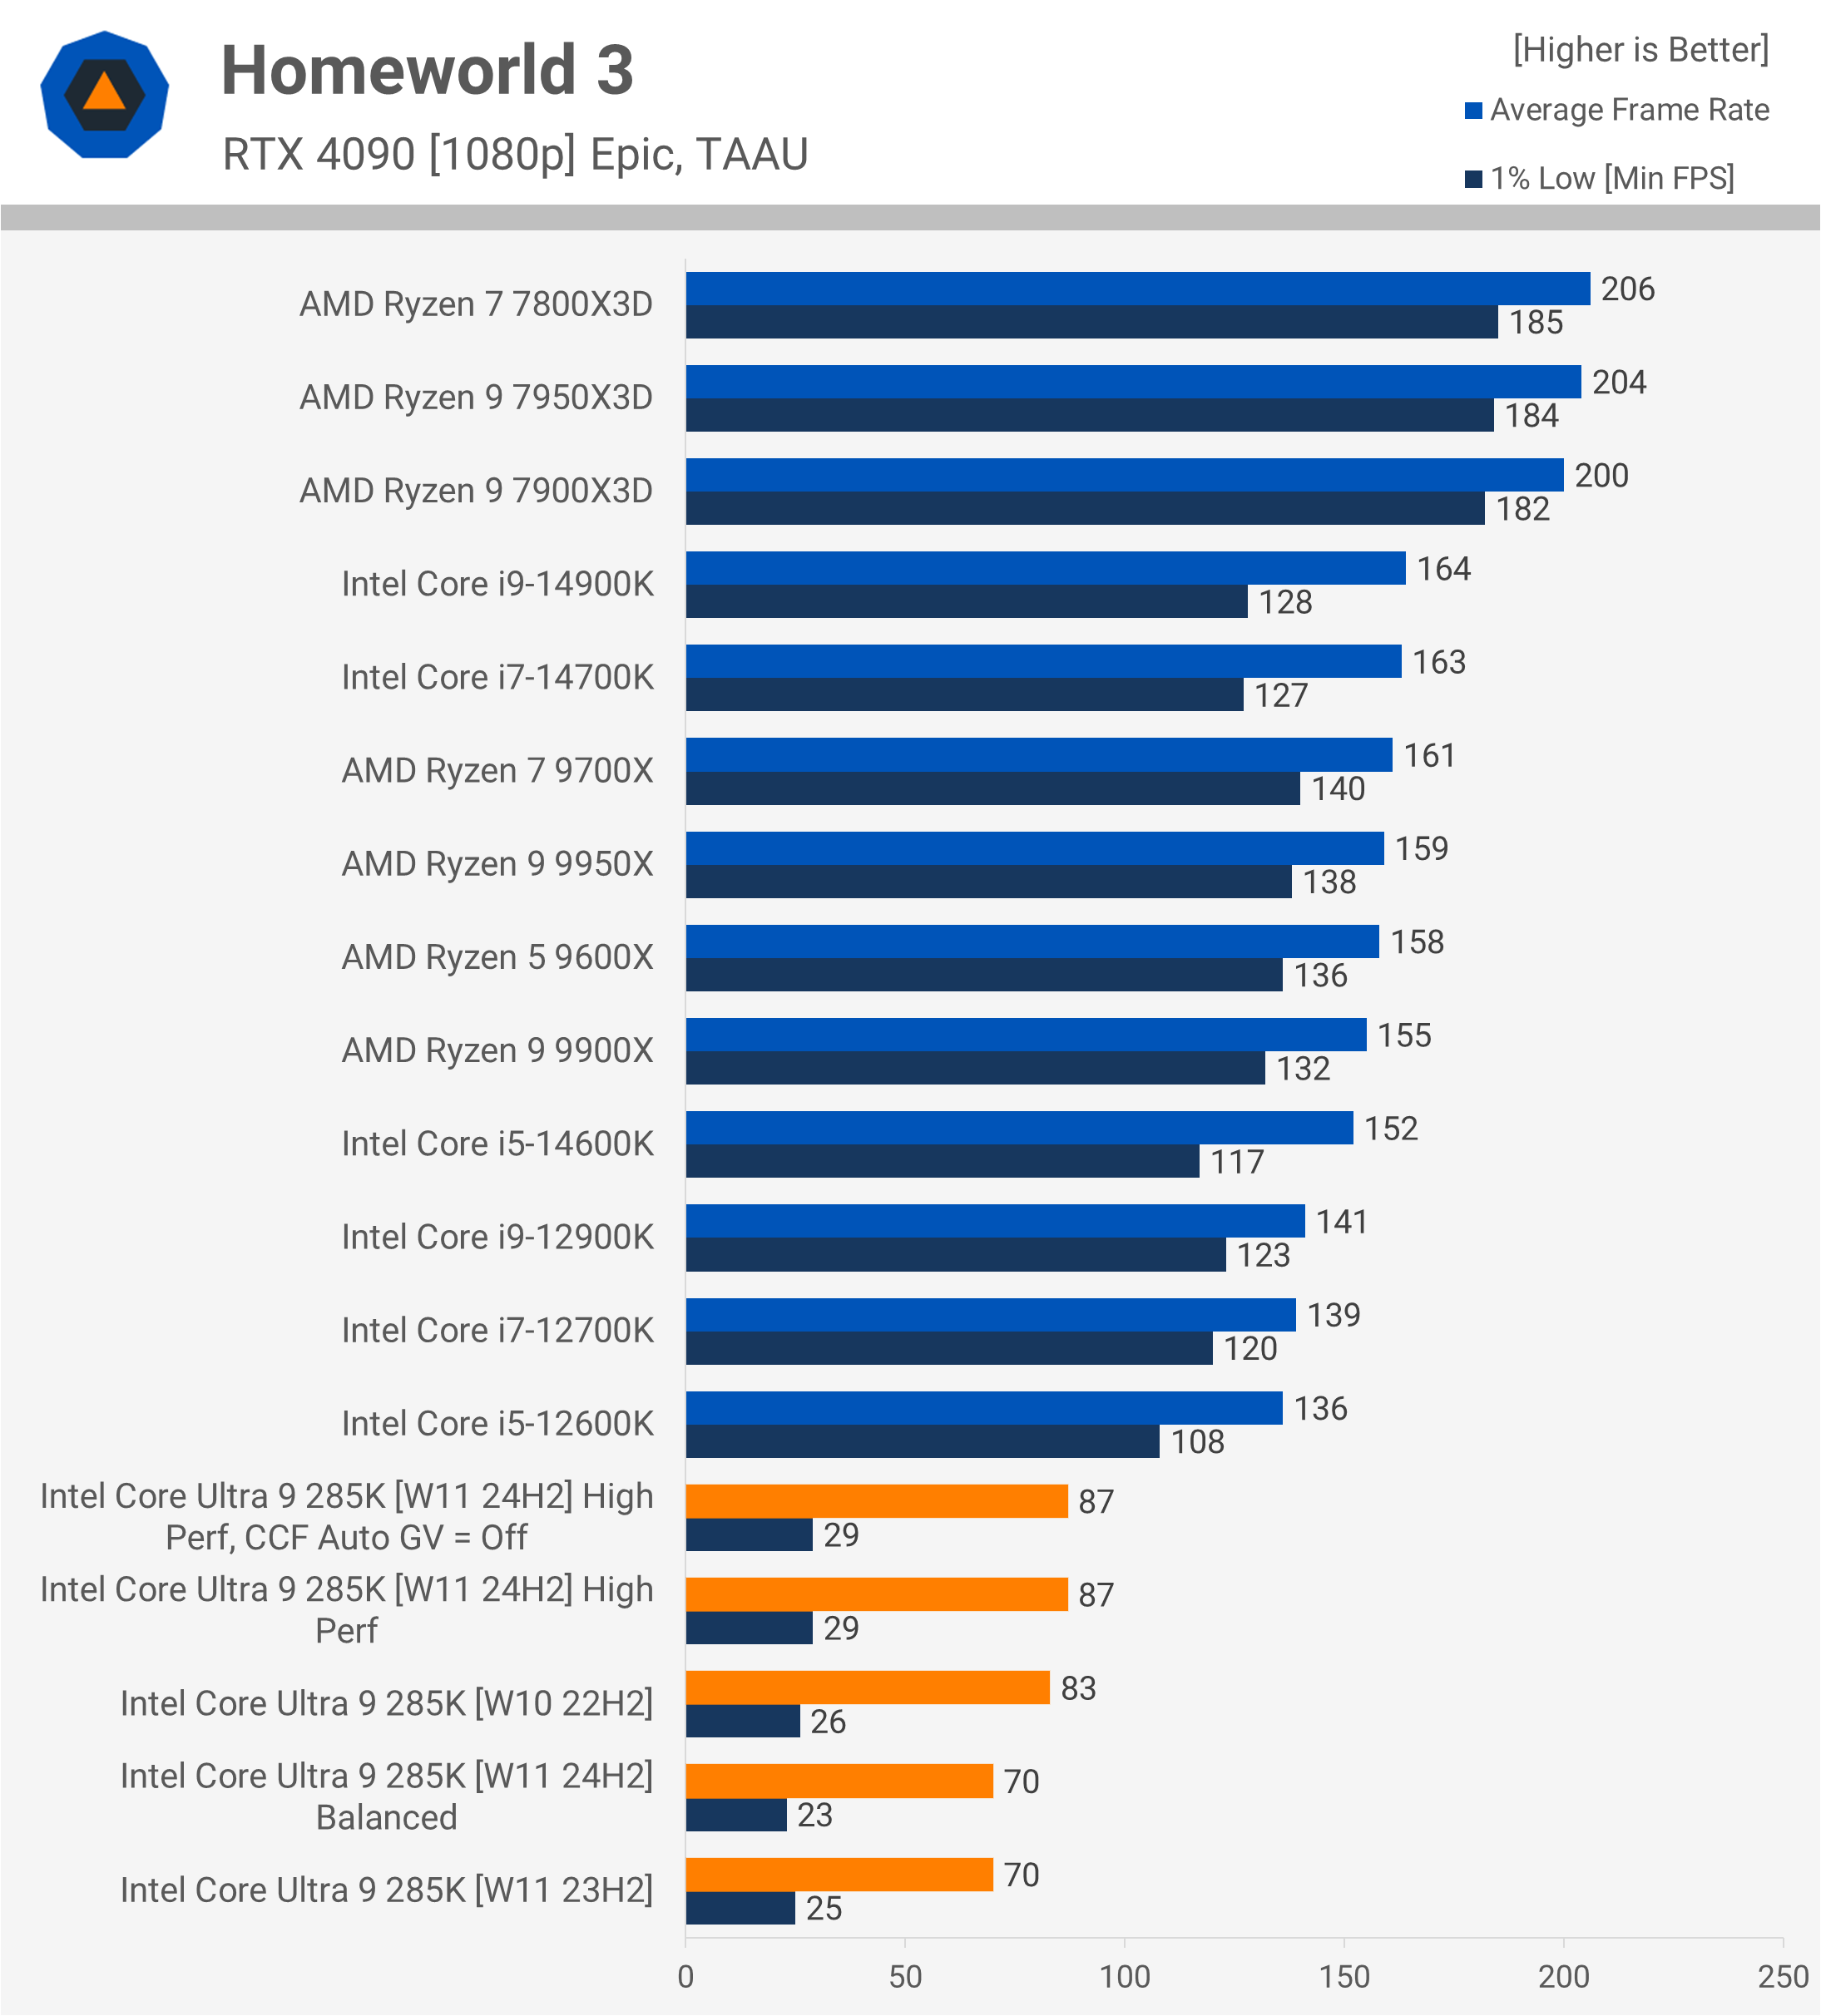
The Homeworld 3 data underscores just how erratic the Arrow Lake testing has been, though the results align with expectations. We know Homeworld 3 performs poorly on 23H2, while 24H2 significantly boosts performance for Intel’s 13th and 14th-gen and AMD Ryzen processors. The fact that Windows 10 performed 20% better than 23H2 makes sense in this context.
What doesn’t make sense initially is the lack of improvement on 24H2 for the 285K – until you manually adjust the power plan. After doing so, the performance matched the Core i7-14700K.
Unfortunately for Intel, we have to choose a single OS configuration for testing, and there seems to be no perfect option where everything works as it should, at least not at this time.
A Plague Tale: Requiem
Performance in A Plague Tale: Requiem was disappointing on the 285K, and switching to 24H2 didn’t resolve the issue. Oddly, Windows 10 performed poorly in this title, though this was a trend we observed in a few of the 14 games tested.
Counter-Strike 2
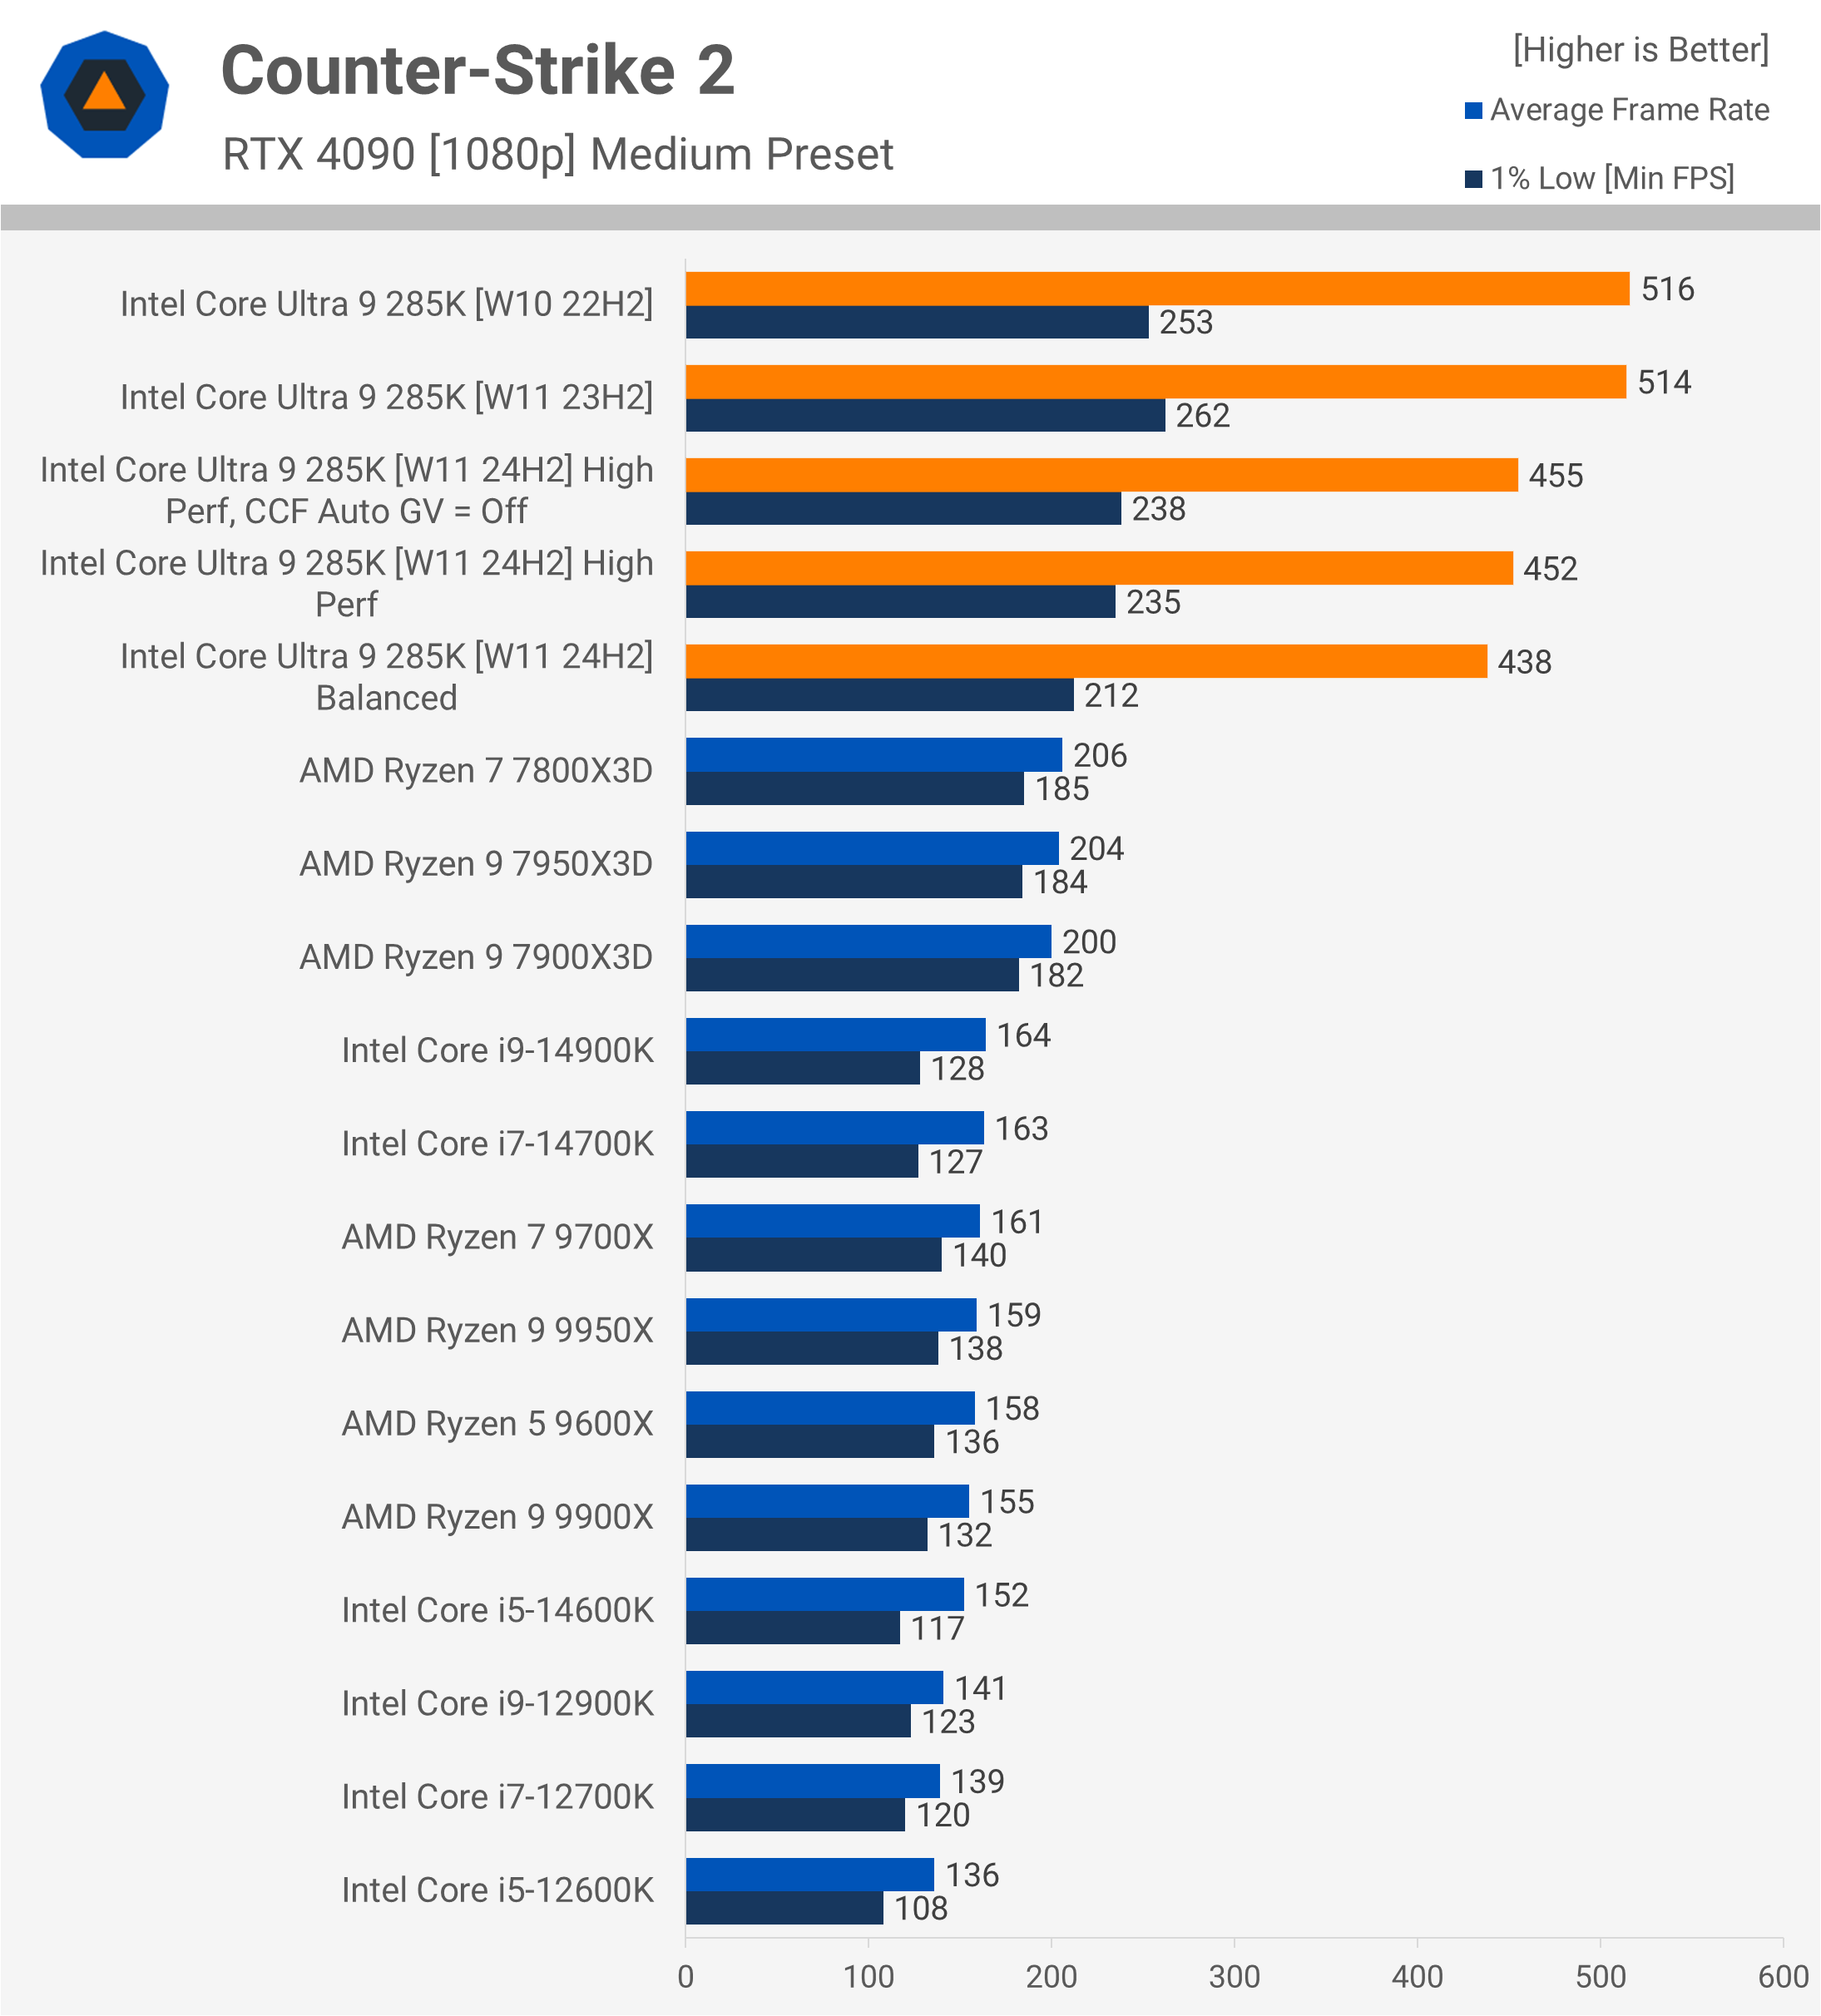
In Counter-Strike 2, the performance on 23H2 matched what we saw with Windows 10. However, 24H2 was consistently slower, though switching to the high performance power profile provided a small boost.
Intel APO Optimization
Lastly, it’s important to note that all the gaming benchmarks you just saw were run without Intel’s APO (Application Optimization) feature enabled. This feature was not enabled by default during our testing, but Intel has indicated that this will be addressed in future BIOS updates.
We didn’t focus on this for two reasons. First, out of the 14 games we tested, only two – Counter-Strike 2 and Cyberpunk 2077 – support APO. Second, out of curiosity, we went back and enabled APO in those games and found only a 1-2% change in performance, which falls within the margin of error.
This suggests that either APO has minimal impact on those titles, or it isn’t fully functional yet. We will revisit this feature in future content to see if there are any significant updates or improvements.
What We Learned: Inconsistent Gaming Performance
So, there we have it – a chaotic mix of results that often don’t seem to make much sense. Clearly, Intel has a significant number of issues to resolve, and while we didn’t expect them to flawlessly execute a new platform and CPU architecture release, we had hoped for a much more polished product.
Depending on the hardware and software configuration, stability can be an issue, though we expect this to be addressed fairly quickly. However, it’s something worth keeping in mind. We notified Intel about the poor gaming performance, and while they’ve offered a few solutions, none have worked to a degree that we find satisfactory.
As it stands, gaming performance is inconsistent, to say the least. Overall, this is very disappointing for a next-generation flagship product. If Intel can’t make significant improvements, Arrow Lake could end up being a poor choice for gaming.
In terms of productivity, the 285K performs better, but it’s still not exceptional. While there are certainly workloads where it excels, there are many where its performance is underwhelming compared to the 14900K and 9950X.
One area where the 285K has massively improved over the 14900K is power efficiency, which is great news. However, in most cases, it’s still far from where it needs to be to truly compete with AMD.
The price is also problematic. It’s expected to be around $600+, which is far too high. For the same amount, you can get the 9950X or the 7950X3D, and even the 7950X is cheaper at $510. Any one of those AMD CPUs would be a better choice in our opinion.
Even if Intel manages to fully resolve stability issues, fix performance on Windows 11 24H2, and address the inconsistent gaming results, the 285K would still only warrant a price tag of about $500. So, given all that, we’re obviously not recommending the Core Ultra 9 285K at this time, and likely won’t until these issues are resolved.
As for overclocking, given all the current problems and the need to test performance across multiple versions of Windows, we deprioritized overclocking for this initial review. It’s something we’ll no doubt cover in future content, but for now, it’s somewhat irrelevant given the number of issues that need to be addressed first.
Memory overclocking is another topic, and while the review kits came with DDR5-8200 CUDIMM memory, it doesn’t make much sense due to the extreme price and limited performance gains. We’re unsure of the exact cost of this memory, but we know standard UDIMM kits are priced near $300 for a 24GB kit, so the CUDIMM kits will likely be even more expensive.
Therefore, something like DDR5-7200 CL34, priced around $115, seems to be a more reasonable option. Once the issues we’ve discussed are addressed, we’ll look into memory scaling to determine the optimal memory support for Arrow Lake.
Wrapping this review up, we think there is potential for Arrow Lake to get a lot better as it appears under cooked at this stage. While we strongly recommend not rushing out to buy into Intel’s new platform right now, we’re not willing to write it off completely just yet.


