Year to date, U.S. hotel performance has come in a bit weaker than projected with demand almost flat (+.1 percent) and RevPAR growth at +1.1 percent. With modest supply growth pushing occupancy comparisons to negative territory (–.5 percent), there has been less opportunity to drive total revenues as total revenue per available room (TRevPAR) is down .3 percent.
After three consecutive months of slower labor growth, labor costs are back on the rise with a 5.7 percent increase in labor per available room (LPAR). Lower TRevPAR and higher operating expenses (especially labor) have led to exaggerated declines in gross operating profit per available room (GOPPAR), which is down 8.9 percent.
One noteworthy positive in the metrics is group business performing above last year with a continuation of the bifurcation trend that has been playing out. Upper upscale and upscale chains have grown RevPAR by more than 1 percent, while growth for luxury chains (+.2 percent) has been more muted. Improved demand for groups has meant more revenue opportunity outside of the rooms department, specifically food & beverage.
Total F&B revenues are up 1.4 percent compared to last year and currently sit at 106.9 percent of 2019 levels. When accounting for inflation, F&B revenues are at 87.9 percent of 2019 levels. The biggest F&B revenue growth has been with other F&B, which has increased 7.6 percent on a PAR basis and includes non-consumable F&B items like A/V costs and room rentals. Food sales PAR has realized the second highest growth at +6.4 percent. However, with growth in revenues comes growth in expenses, which have risen at a much faster rate than revenues. Total F&B expenses PAR were up 9.6 percent year over year, with the biggest contributor being labor (+5.1 percent).
Focusing on just full-service properties in the luxury, upper upscale, and upscale classes, F&B revenues PAR are up 7.5 percent year over year, while expenses are up only 3.4 percent. The upper-upscale class has realized the largest growth year over year in revenues PAR (+5.8 percent), boosted primarily by strong growth in other F&B (+7.7 percent) and food (+6.6 percent).
Although there is consistent strong growth amongst F&B revenues for these three classes, growth rates are stronger on the expense side and have limited the opportunity for margin growth. Margins for these classes are an average of 1.6 points lower than 2019 and 1.7 points lower than 2023. Again, labor is playing a major role in lower margins as F&B labor for these three classes is up $10 per occupied room (POR), which is a 26.3 percent increase since 2019.
Top 25 Markets
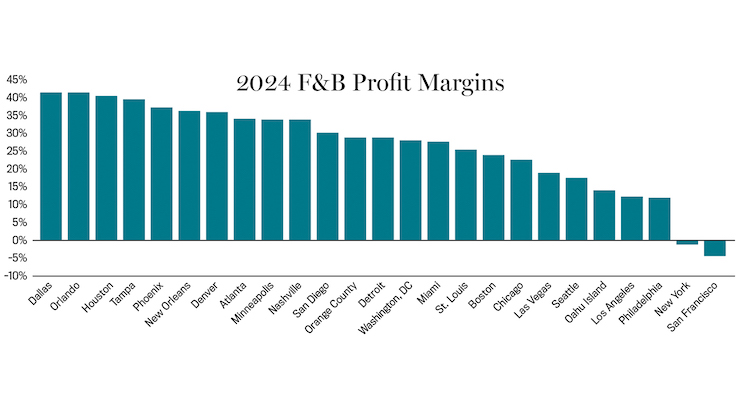
Much of the labor pressure tends to come from bigger markets, and although the Top 25 Markets have been outperforming all other markets, their expenses tend to reflect that higher demand. F&B revenues PAR in the Top 25 Markets is up 4.4 percent for all properties and 6.1 percent for full-service properties, while their expenses are up 8.5 percent and 6.9 percent, respectively. Dallas, Atlanta, and Nashville are realizing the highest growth in F&B revenues, while San Francisco, New York City, and Philadelphia are reporting the lowest F&B profit margins. Only eight of the Top 25 Markets are realizing higher profit margins than last year.
The Need for Creativity
In any industry, pressure drives creativity, and the hotel industry is no exception. Hotels have been getting more efficient at creating a dining experience for guests that is also mindful of margins. Technology is one tool in this effort, and hotels are using it to reduce waste, improve scheduling, and alleviate pressure on staff. Additionally, hotel restaurants are elevating the dining experience to attract high-end hotel guests and locals. Along with this effort, they are curating their menu and downsizing offerings so they can focus on providing the best dining experience possible in hopes of driving profit margins.


