- The Dow Jones saw limited momentum in a quiet start to the trading week.
- Equities are overall tilted into the high end, but steeper losses in key stocks drag averages down.
- Investors get to take a breather from high-impact US data until the end of the week.
The Dow Jones Industrial Average (DJIA) held steady on Monday, testing into new weekly lows but overall keeping a tight grip on the 43,450 region. Market sentiment is grappling with a cooling effect that gripped indexes last week following the recent post-election rally.
After several high-impact prints on the economic calendar last week, traders get a chance to catch their breath with the US data docket on the moderate side until S&P Purchasing Managers Index (PMI) figures for November print on Friday. Mid-tier residential construction starts and permits will be reported on Tuesday, with a couple of outings from Federal Reserve (Fed) officials on Wednesday and weekly unemployment benefits claimants on Thursday.
Dow Jones news
Equities are broadly higher on Monday, with two-thirds of the Dow Jones’ constituent securities climbing from the week’s opening bids. However, losses were concentrated in Nike (NKE) which declined nearly 3% to $74.50 per share. According to analysts, investors are growing concerned that the shoe manufacturer could be looking at downside revisions to guidance in FY 2026 as the footwear giant faces downward pressure from potential US tariffs aimed at China. Tailwinds from an announced increase in Nike cash dividends is getting further crimped by an overall disappointing economic outlook in China.
Dow Jones price forecast
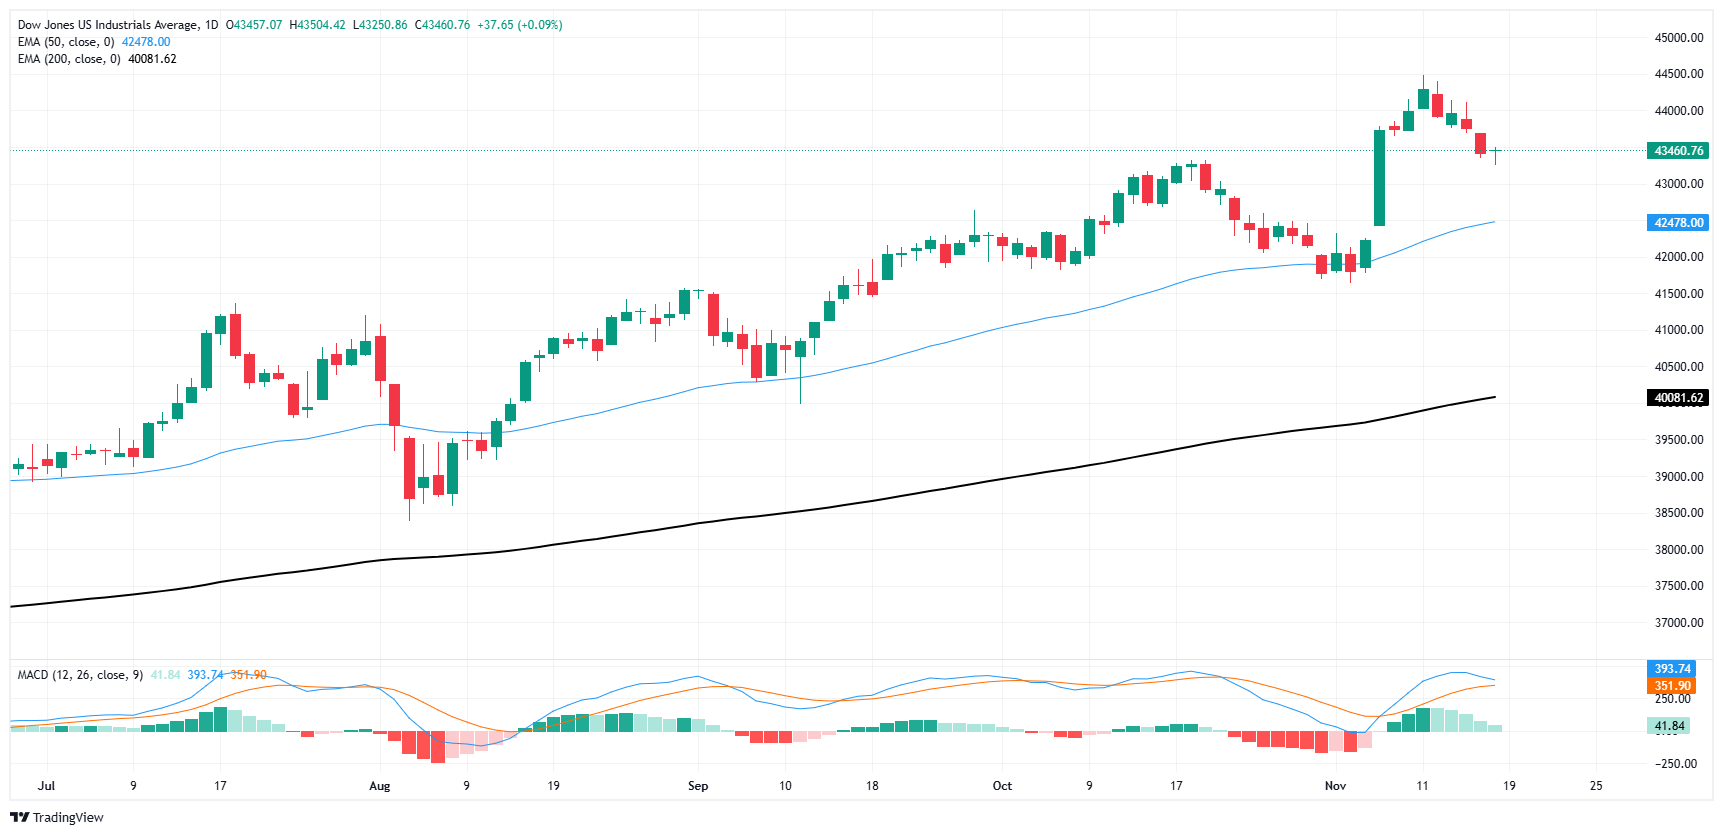
The Dow Jones index is churning chart paper near 43,450, holding steady near familiar lows despite a brief test into fresh lows earlier Monday, softening an approach back toward the 43,000 handle. Despite early November’s post-election splurge, the Dow has steadily declined, shedding 2.77% top-to-bottom from record highs at 44,485.
Despite a near-term swing into the bearish side, the Dow Jones is holding firmly in the bullish end, trading north of the 50-day Exponential Moving Average (EMA). Even if bears maintain control in the immediate window, a one-sided bull run baked into charts since October of 2023 has left price action well north of the 200-day EMA at 40,250.
Dow Jones daily chart
Economic Indicator
S&P Global Services PMI
The S&P Global Services Purchasing Managers Index (PMI), released on a monthly basis, is a leading indicator gauging business activity in the US services sector. As the services sector dominates a large part of the economy, the Services PMI is an important indicator gauging the state of overall economic conditions. The data is derived from surveys of senior executives at private-sector companies from the services sector. Survey responses reflect the change, if any, in the current month compared to the previous month and can anticipate changing trends in official data series such as Gross Domestic Product (GDP), industrial production, employment and inflation. A reading above 50 indicates that the services economy is generally expanding, a bullish sign for the US Dollar (USD). Meanwhile, a reading below 50 signals that activity among service providers is generally declining, which is seen as bearish for USD.
Next release: Fri Nov 22, 2024 14:45 (Prel)
Frequency: Monthly
Consensus: 55.2
Previous: 55
Source: S&P Global
Information on these pages contains forward-looking statements that involve risks and uncertainties. Markets and instruments profiled on this page are for informational purposes only and should not in any way come across as a recommendation to buy or sell in these assets. You should do your own thorough research before making any investment decisions. FXStreet does not in any way guarantee that this information is free from mistakes, errors, or material misstatements. It also does not guarantee that this information is of a timely nature. Investing in Open Markets involves a great deal of risk, including the loss of all or a portion of your investment, as well as emotional distress. All risks, losses and costs associated with investing, including total loss of principal, are your responsibility. The views and opinions expressed in this article are those of the authors and do not necessarily reflect the official policy or position of FXStreet nor its advertisers. The author will not be held responsible for information that is found at the end of links posted on this page.
If not otherwise explicitly mentioned in the body of the article, at the time of writing, the author has no position in any stock mentioned in this article and no business relationship with any company mentioned. The author has not received compensation for writing this article, other than from FXStreet.
FXStreet and the author do not provide personalized recommendations. The author makes no representations as to the accuracy, completeness, or suitability of this information. FXStreet and the author will not be liable for any errors, omissions or any losses, injuries or damages arising from this information and its display or use. Errors and omissions excepted.
The author and FXStreet are not registered investment advisors and nothing in this article is intended to be investment advice.


