- USD/JPY declines from highs of 155.86, settling at 154.51 amid tariff-induced volatility.
- ISM Manufacturing PMI rises, signaling robust business activity despite global trade fears.
- Bank of Japan maintains optimistic outlook, ready to navigate Trump’s protectionist policies.
The USD/JPY retreated from daily highs of 155.86 hit after US President Donald Trump advanced on its protectionist policies, enacting tariffs in Canada, Mexico, and China. Initially, the Greenback rose, but as fears faded, the pair dipped below its opening price by 0.44% and traded at 154.51.
Yen strengthens after initial drop as Trump’s new tariffs unsettle markets
Market participants seem worried, as portrayed by global equities trading in the red. US President Trump applied 25% tariffs on Canada and Mexico and 10% to China. US-North American partners vowed retaliatory measures, while the latter, would challenge this policy at the World Trade Organization (WTO).
At the time of writing, the ISM Manufacturing PMI for January increased by 50.9, exceeding forecasts of 49.8. It was up from December 49.2, an indication of improvement in business activity. Digging deeper into the data, the sub-component of prices paid advanced from 52.5 to 54.9, while the employment index improved from 45.4 in December to 50.3.
In the meantime, during the Asian session, the Bank of Japan revealed its January meeting Summary of Opinions. Some of the members added that inflation expectations are heightening as prices rise above the 2% inflation target, and others said that hiking rates would be sufficiently neutral. Policymakers stated that Japan’s economy is resilient and can navigate through protectionist policies implemented by Trump.
This week, the US economic docket will feature Fed speakers, JOLTS Job Orders data, and Factory Orders on February 4. In Japan, the schedule is light with the Jibun Bank Services PMI final release for January.
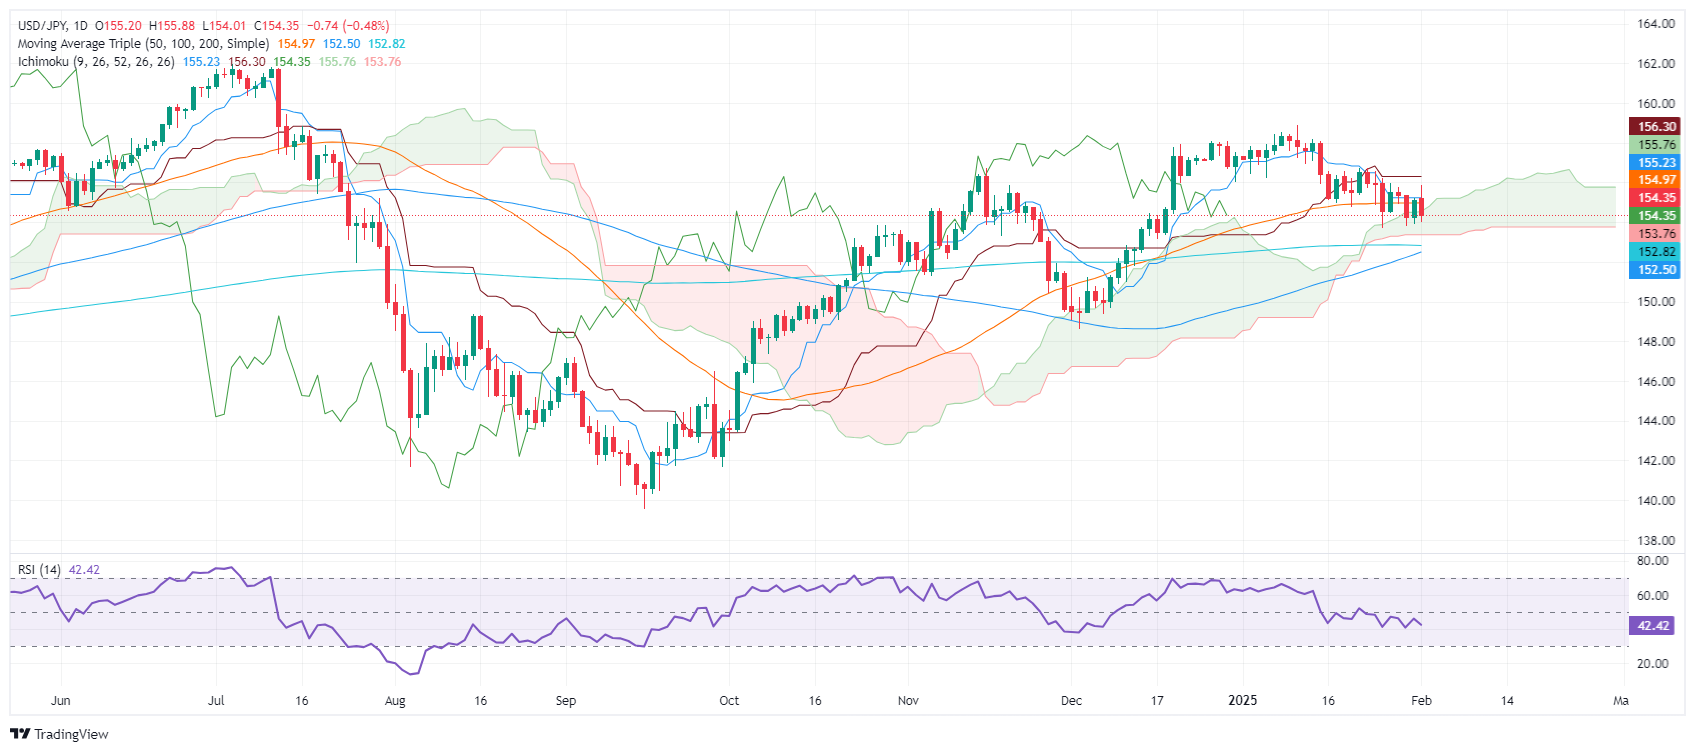
USD/JPY Price Analysis: Technical outlook
The USD/JPY is forming a ‘bearish candle’ with a long upper shadow, an indication that the pair is not finding acceptance within the 154.78-155.88 range. This is bearish, as seen by price action, with the pair extending its downtrend inside the Ichimoku Cloud (Kumo). Sellers are eyeing the next support at Senkou Span B at 153.76.
On further weakness, the next support would be the 200-day Simple Moving Average (SMA) at 152.83
On the other hand, if buyers achieve a daily close above 155.00, look for further upside. Key resistance is found at the Senkow Span A at 155.76.
Japanese Yen PRICE Today
The table below shows the percentage change of Japanese Yen (JPY) against listed major currencies today. Japanese Yen was the strongest against the New Zealand Dollar.
| USD | EUR | GBP | JPY | CAD | AUD | NZD | CHF | |
|---|---|---|---|---|---|---|---|---|
| USD | 0.69% | 0.16% | -0.48% | -0.48% | 0.70% | 0.30% | -0.34% | |
| EUR | -0.69% | -0.21% | 0.08% | -0.09% | 0.39% | 0.70% | 0.06% | |
| GBP | -0.16% | 0.21% | -0.86% | 0.12% | 0.61% | 0.91% | 0.28% | |
| JPY | 0.48% | -0.08% | 0.86% | -0.12% | 1.32% | 1.54% | 0.67% | |
| CAD | 0.48% | 0.09% | -0.12% | 0.12% | 0.19% | 0.78% | 0.15% | |
| AUD | -0.70% | -0.39% | -0.61% | -1.32% | -0.19% | 0.30% | -0.43% | |
| NZD | -0.30% | -0.70% | -0.91% | -1.54% | -0.78% | -0.30% | -0.63% | |
| CHF | 0.34% | -0.06% | -0.28% | -0.67% | -0.15% | 0.43% | 0.63% |
The heat map shows percentage changes of major currencies against each other. The base currency is picked from the left column, while the quote currency is picked from the top row. For example, if you pick the Japanese Yen from the left column and move along the horizontal line to the US Dollar, the percentage change displayed in the box will represent JPY (base)/USD (quote).
Information on these pages contains forward-looking statements that involve risks and uncertainties. Markets and instruments profiled on this page are for informational purposes only and should not in any way come across as a recommendation to buy or sell in these assets. You should do your own thorough research before making any investment decisions. FXStreet does not in any way guarantee that this information is free from mistakes, errors, or material misstatements. It also does not guarantee that this information is of a timely nature. Investing in Open Markets involves a great deal of risk, including the loss of all or a portion of your investment, as well as emotional distress. All risks, losses and costs associated with investing, including total loss of principal, are your responsibility. The views and opinions expressed in this article are those of the authors and do not necessarily reflect the official policy or position of FXStreet nor its advertisers. The author will not be held responsible for information that is found at the end of links posted on this page.
If not otherwise explicitly mentioned in the body of the article, at the time of writing, the author has no position in any stock mentioned in this article and no business relationship with any company mentioned. The author has not received compensation for writing this article, other than from FXStreet.
FXStreet and the author do not provide personalized recommendations. The author makes no representations as to the accuracy, completeness, or suitability of this information. FXStreet and the author will not be liable for any errors, omissions or any losses, injuries or damages arising from this information and its display or use. Errors and omissions excepted.
The author and FXStreet are not registered investment advisors and nothing in this article is intended to be investment advice.