
- GBP/USD rises maintaining position above the 50-day SMA as market digests US tariff negotiations.
- US labor market shows strength with ADP employment figures surpassing expectations, spotlight on Nonfarm Payrolls.
- UK economic indicators show slight downturn, with market eyes on BoE’s anticipated rate cut.
The Pound Sterling remains bid for the third consecutive day, edges up 0.34% as the GBP/USD trades at 1.2519 above the 50-day Simple Moving Average (SMA) at 1.2501.
GBP/USD ascends modestly, bolstered by positive market sentiment
The Greenback has erased most of its Monday’s gains, spurred by the US imposing tariffs on Mexico and Canada. However, both countries reached agreements with Washington. Therefore, investors who once seemed uncertain about US trade policies are confident that US President Donald Trump is using tariffs as a “tool” to negotiate with allies and adversaries.
Data has taken a backseat, with traders eyeing the release of US Nonfarm Payroll figures for January. Wednesday’s US docket featured ADP National Employment Change for January. The numbers exceeded estimates of 150K and rose by 183K, an indication of strength in the labor market.
At the same time, business activity continued to deteriorate. S&P Global featured Services PMI for January, which dipped from 56.8 to 52.9, better than the 52.8 expected. Up next, the Institute for Supply Management (ISM) will feature the Non-Manufacturing PMI, foreseen to increase from 54.1 to 54.3.
Across the pond, January’s UK S&P Global Services PMI dipped from 51.1 to 50.8 as economic conditions worsened. Traders await the Bank of England’s (BoE) monetary policy decision on Thursday, poised to reduce rates by 25 basis points (bps) from 4.75% to 4.50%, according to Prime Market Terminal data.
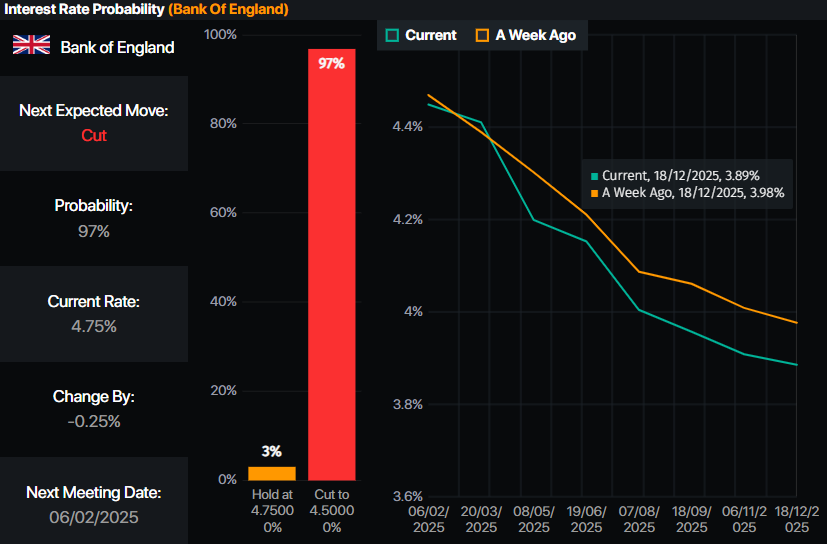
Source: Prime Market Terminal
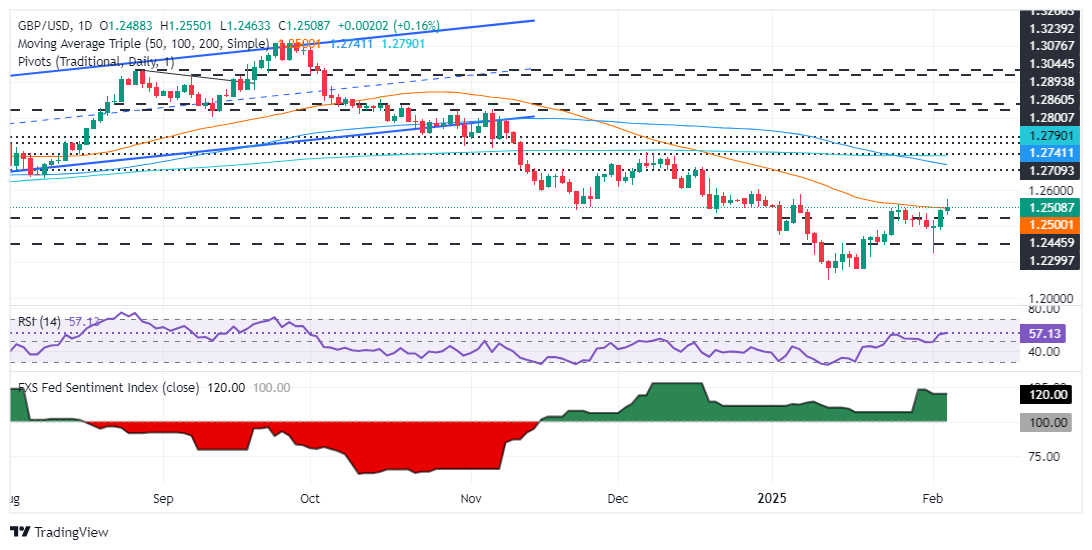
GBP/USD Price Forecast: Technical outlook
The GBP/USD cleared the January 27 peak of 1.2523, a strong resistance level, and reached a new four-week peak at 1.2549. Although bullish, a daily close above the former would open the door to challenge the year-to-date (YTD) high of 1.2575 and the 1.2600 figure.
If there is a failure to clear 1.2550, sellers could be set to push GBP/USD lower, with trades eyeing 1.2400. Further downside lies underneath the January 2 low of 1.2351, followed by the February 3 low of 1.2248.
British Pound PRICE Today
The table below shows the percentage change of British Pound (GBP) against listed major currencies today. British Pound was the strongest against the US Dollar.
| USD | EUR | GBP | JPY | CAD | AUD | NZD | CHF | |
|---|---|---|---|---|---|---|---|---|
| USD | -0.42% | -0.25% | -1.23% | -0.20% | -0.39% | -0.66% | -0.45% | |
| EUR | 0.42% | 0.19% | -0.78% | 0.22% | 0.03% | -0.25% | -0.02% | |
| GBP | 0.25% | -0.19% | -0.97% | 0.04% | -0.15% | -0.42% | -0.21% | |
| JPY | 1.23% | 0.78% | 0.97% | 1.04% | 0.84% | 0.56% | 0.78% | |
| CAD | 0.20% | -0.22% | -0.04% | -1.04% | -0.19% | -0.45% | -0.25% | |
| AUD | 0.39% | -0.03% | 0.15% | -0.84% | 0.19% | -0.27% | -0.08% | |
| NZD | 0.66% | 0.25% | 0.42% | -0.56% | 0.45% | 0.27% | 0.22% | |
| CHF | 0.45% | 0.02% | 0.21% | -0.78% | 0.25% | 0.08% | -0.22% |
The heat map shows percentage changes of major currencies against each other. The base currency is picked from the left column, while the quote currency is picked from the top row. For example, if you pick the British Pound from the left column and move along the horizontal line to the US Dollar, the percentage change displayed in the box will represent GBP (base)/USD (quote).
Information on these pages contains forward-looking statements that involve risks and uncertainties. Markets and instruments profiled on this page are for informational purposes only and should not in any way come across as a recommendation to buy or sell in these assets. You should do your own thorough research before making any investment decisions. FXStreet does not in any way guarantee that this information is free from mistakes, errors, or material misstatements. It also does not guarantee that this information is of a timely nature. Investing in Open Markets involves a great deal of risk, including the loss of all or a portion of your investment, as well as emotional distress. All risks, losses and costs associated with investing, including total loss of principal, are your responsibility. The views and opinions expressed in this article are those of the authors and do not necessarily reflect the official policy or position of FXStreet nor its advertisers. The author will not be held responsible for information that is found at the end of links posted on this page.
If not otherwise explicitly mentioned in the body of the article, at the time of writing, the author has no position in any stock mentioned in this article and no business relationship with any company mentioned. The author has not received compensation for writing this article, other than from FXStreet.
FXStreet and the author do not provide personalized recommendations. The author makes no representations as to the accuracy, completeness, or suitability of this information. FXStreet and the author will not be liable for any errors, omissions or any losses, injuries or damages arising from this information and its display or use. Errors and omissions excepted.
The author and FXStreet are not registered investment advisors and nothing in this article is intended to be investment advice.


