
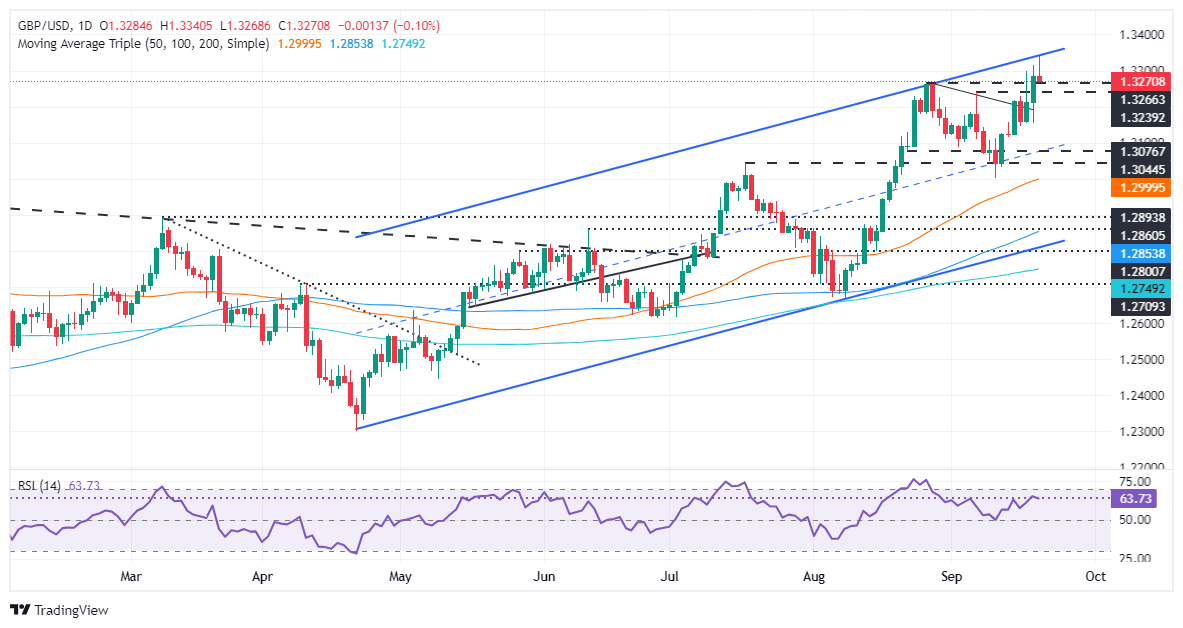
- GBP/USD hits resistance at 1.3340 and forms a potential ‘shooting star’ candlestick, signaling possible further losses.
- Key support lies at 1.3250, with additional levels at 1.3239, 1.3200, and the July 14 peak at 1.3142.
- On the upside, GBP/USD must reclaim 1.3300 to retest the YTD high of 1.3340, with further resistance at 1.3437.
The Pound Sterling registered minimal gains versus the US Dollar during the North American session after reaching a two-and-a-half-year high of 1.3340 on an upbeat retail sales report in the UK. At the time of writing, the GBP/USD trades at 1.3282, a gain of 0.03%.
GBP/USD Price Forecast: Technical outlook
From a technical standpoint, the GBP/USD clashed with solid resistance as the pair reached the top of an ascending channel shy of testing 1.3350. Since then, the pair erased those gains, about to form a ‘shooting star’ candle, which opens the door for further losses.
Momentum remains bullish according to the Relative Strength Index (RSI). However, a negative divergence looms, which could spur a pullback in the pair.
If GBP/USD tumbles below 1.3250, further downside is seen. Once cleared, the next stop would be the September 6 peak at 1.3239, ahead of 1.3200. If surpassed, key support levels will be exposed, like the July 14, 2023, peak at 1.3142, followed by the September 11 low of 1.3001.
Conversely, if GBP/USD reclaims 1.3300, the first resistance would be the year-to-date (YTD) high of 1.3340 ahead of the March 1, 2022, pivot high at 1.3437.
GBP/USD Price Action – Daily Chart
British Pound PRICE Today
The table below shows the percentage change of British Pound (GBP) against listed major currencies today. British Pound was the strongest against the Japanese Yen.
| USD | EUR | GBP | JPY | CAD | AUD | NZD | CHF | |
|---|---|---|---|---|---|---|---|---|
| USD | 0.20% | 0.10% | 1.21% | 0.19% | 0.45% | 0.40% | 0.39% | |
| EUR | -0.20% | -0.11% | 1.05% | -0.03% | 0.23% | 0.21% | 0.20% | |
| GBP | -0.10% | 0.11% | 1.15% | 0.10% | 0.36% | 0.33% | 0.32% | |
| JPY | -1.21% | -1.05% | -1.15% | -1.01% | -0.77% | -0.81% | -0.80% | |
| CAD | -0.19% | 0.03% | -0.10% | 1.01% | 0.25% | 0.22% | 0.22% | |
| AUD | -0.45% | -0.23% | -0.36% | 0.77% | -0.25% | -0.01% | -0.02% | |
| NZD | -0.40% | -0.21% | -0.33% | 0.81% | -0.22% | 0.01% | -0.00% | |
| CHF | -0.39% | -0.20% | -0.32% | 0.80% | -0.22% | 0.02% | 0.00% |
The heat map shows percentage changes of major currencies against each other. The base currency is picked from the left column, while the quote currency is picked from the top row. For example, if you pick the British Pound from the left column and move along the horizontal line to the US Dollar, the percentage change displayed in the box will represent GBP (base)/USD (quote).
Information on these pages contains forward-looking statements that involve risks and uncertainties. Markets and instruments profiled on this page are for informational purposes only and should not in any way come across as a recommendation to buy or sell in these assets. You should do your own thorough research before making any investment decisions. FXStreet does not in any way guarantee that this information is free from mistakes, errors, or material misstatements. It also does not guarantee that this information is of a timely nature. Investing in Open Markets involves a great deal of risk, including the loss of all or a portion of your investment, as well as emotional distress. All risks, losses and costs associated with investing, including total loss of principal, are your responsibility. The views and opinions expressed in this article are those of the authors and do not necessarily reflect the official policy or position of FXStreet nor its advertisers. The author will not be held responsible for information that is found at the end of links posted on this page.
If not otherwise explicitly mentioned in the body of the article, at the time of writing, the author has no position in any stock mentioned in this article and no business relationship with any company mentioned. The author has not received compensation for writing this article, other than from FXStreet.
FXStreet and the author do not provide personalized recommendations. The author makes no representations as to the accuracy, completeness, or suitability of this information. FXStreet and the author will not be liable for any errors, omissions or any losses, injuries or damages arising from this information and its display or use. Errors and omissions excepted.
The author and FXStreet are not registered investment advisors and nothing in this article is intended to be investment advice.


