
- GBP/USD drops but holds above the key 1.2900 psychological level amid ongoing uncertainty.
- UK economy unexpectedly shrank 0.1% in January, raising bets on future Bank of England rate cuts.
- US consumer inflation expectations surge, complicating Fed decisions ahead of critical US tariff implementation on April 2.
The Pound Sterling (GBP) registers back-to-back bearish days, dropping some 0.14% on Friday against the Greenback after economic data from the United Kingdom (UK) revealed that the Gross Domestic Product (GDP) contracted. Despite this, GBP/USD is trading above the 1.2900 figure, poised to finish the day near this level.
GBP/USD pressured after UK GDP miss while rising US inflation expectations complicate Fed’s next move
Recently, data from the University of Michigan (UoM) showed that Consumer Sentiment in March deteriorated, from 64.7 to 57.9, below forecast of 63.1. Notably, inflation expectations jumped, with Americans seeing 12-month inflation up from 4.3% to 4.9%. Over a five-year period, consumers saw prices running at 3.9%, up from 3.5%.
GBP/USD traders’ eyes are on next week’s central bank bonanza, beginning with the Federal Reserve (Fed). Last Friday, Fed Chair Jerome Powell revealed that “market measures of inflation expectations have moved up, driven by tariffs.”
Therefore, this Friday’s reading could prevent the Fed from easing policy as US President Donald Trump will enact reciprocal tariffs on April 2.
Across the pond, the British economy shrank unexpectedly by -0.1% MoM in January, missing the 0.1% expansion estimated by analysts. After the data, interest rate swaps priced in 56 basis points of interest rate cuts by the Bank of England (BoE) in 2025, which is expected to hold rates next Thursday.
Next week, data from the UK will feature the jobs report, S&P Global Flash PMIs and the BoE interest rate decision. For the US, traders will look at Retail Sales, housing data, the Fed’s monetary policy decisions and economic projections.
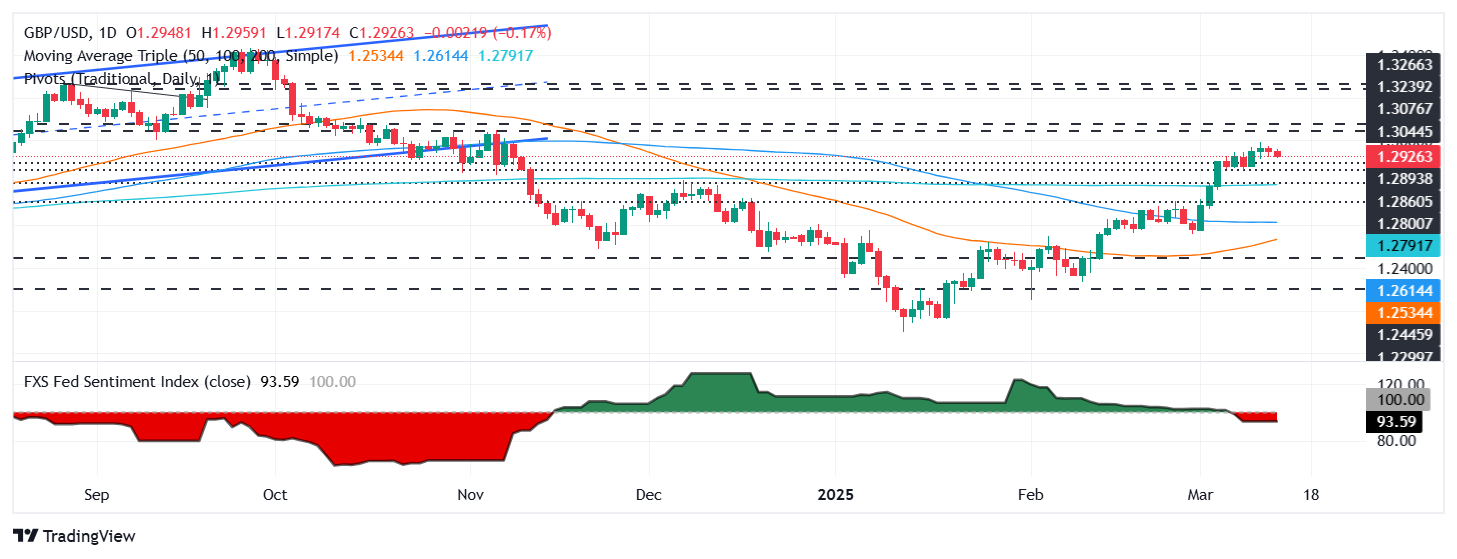
GBP/USD Price Forecast: Technical outlook
Despite retreating towards 1.2900 and reaching a two-day low of 1.2916, traders seem reluctant to push GBP/USD lower after the pair cleared the 200-day Simple Moving Average (SMA) at 1.2791 on March 5. If buyers clear 1.2950, the next resistance would be 1.3000. Conversely, a drop beneath 1.2900 will expose the current week’s low of 1.2860, which is ahead of the 200-day SMA.
British Pound PRICE Today
The table below shows the percentage change of British Pound (GBP) against listed major currencies today. British Pound was the strongest against the Japanese Yen.
| USD | EUR | GBP | JPY | CAD | AUD | NZD | CHF | |
|---|---|---|---|---|---|---|---|---|
| USD | -0.29% | 0.14% | 0.45% | -0.34% | -0.63% | -0.86% | 0.27% | |
| EUR | 0.29% | 0.47% | 0.73% | -0.04% | -0.35% | -0.58% | 0.65% | |
| GBP | -0.14% | -0.47% | 0.25% | -0.53% | -0.81% | -1.03% | 0.18% | |
| JPY | -0.45% | -0.73% | -0.25% | -0.79% | -1.07% | -1.29% | -0.07% | |
| CAD | 0.34% | 0.04% | 0.53% | 0.79% | -0.27% | -0.52% | 0.70% | |
| AUD | 0.63% | 0.35% | 0.81% | 1.07% | 0.27% | -0.23% | 0.94% | |
| NZD | 0.86% | 0.58% | 1.03% | 1.29% | 0.52% | 0.23% | 1.23% | |
| CHF | -0.27% | -0.65% | -0.18% | 0.07% | -0.70% | -0.94% | -1.23% |
The heat map shows percentage changes of major currencies against each other. The base currency is picked from the left column, while the quote currency is picked from the top row. For example, if you pick the British Pound from the left column and move along the horizontal line to the US Dollar, the percentage change displayed in the box will represent GBP (base)/USD (quote).
Information on these pages contains forward-looking statements that involve risks and uncertainties. Markets and instruments profiled on this page are for informational purposes only and should not in any way come across as a recommendation to buy or sell in these assets. You should do your own thorough research before making any investment decisions. FXStreet does not in any way guarantee that this information is free from mistakes, errors, or material misstatements. It also does not guarantee that this information is of a timely nature. Investing in Open Markets involves a great deal of risk, including the loss of all or a portion of your investment, as well as emotional distress. All risks, losses and costs associated with investing, including total loss of principal, are your responsibility. The views and opinions expressed in this article are those of the authors and do not necessarily reflect the official policy or position of FXStreet nor its advertisers. The author will not be held responsible for information that is found at the end of links posted on this page.
If not otherwise explicitly mentioned in the body of the article, at the time of writing, the author has no position in any stock mentioned in this article and no business relationship with any company mentioned. The author has not received compensation for writing this article, other than from FXStreet.
FXStreet and the author do not provide personalized recommendations. The author makes no representations as to the accuracy, completeness, or suitability of this information. FXStreet and the author will not be liable for any errors, omissions or any losses, injuries or damages arising from this information and its display or use. Errors and omissions excepted.
The author and FXStreet are not registered investment advisors and nothing in this article is intended to be investment advice.


